Anyone who has experienced lengthy car trips with young children may shudder when the question “Are we nearly there yet?” is asked, as it brings to mind the repetitive articulation of youngsters who grow increasingly desperate to reach their destination. Similar sentiments of impatience, frustration and urgency can be found in today’s real-estate market, as investors await signs the market has reached its bottom and a recovery is emerging.
Where are we now?
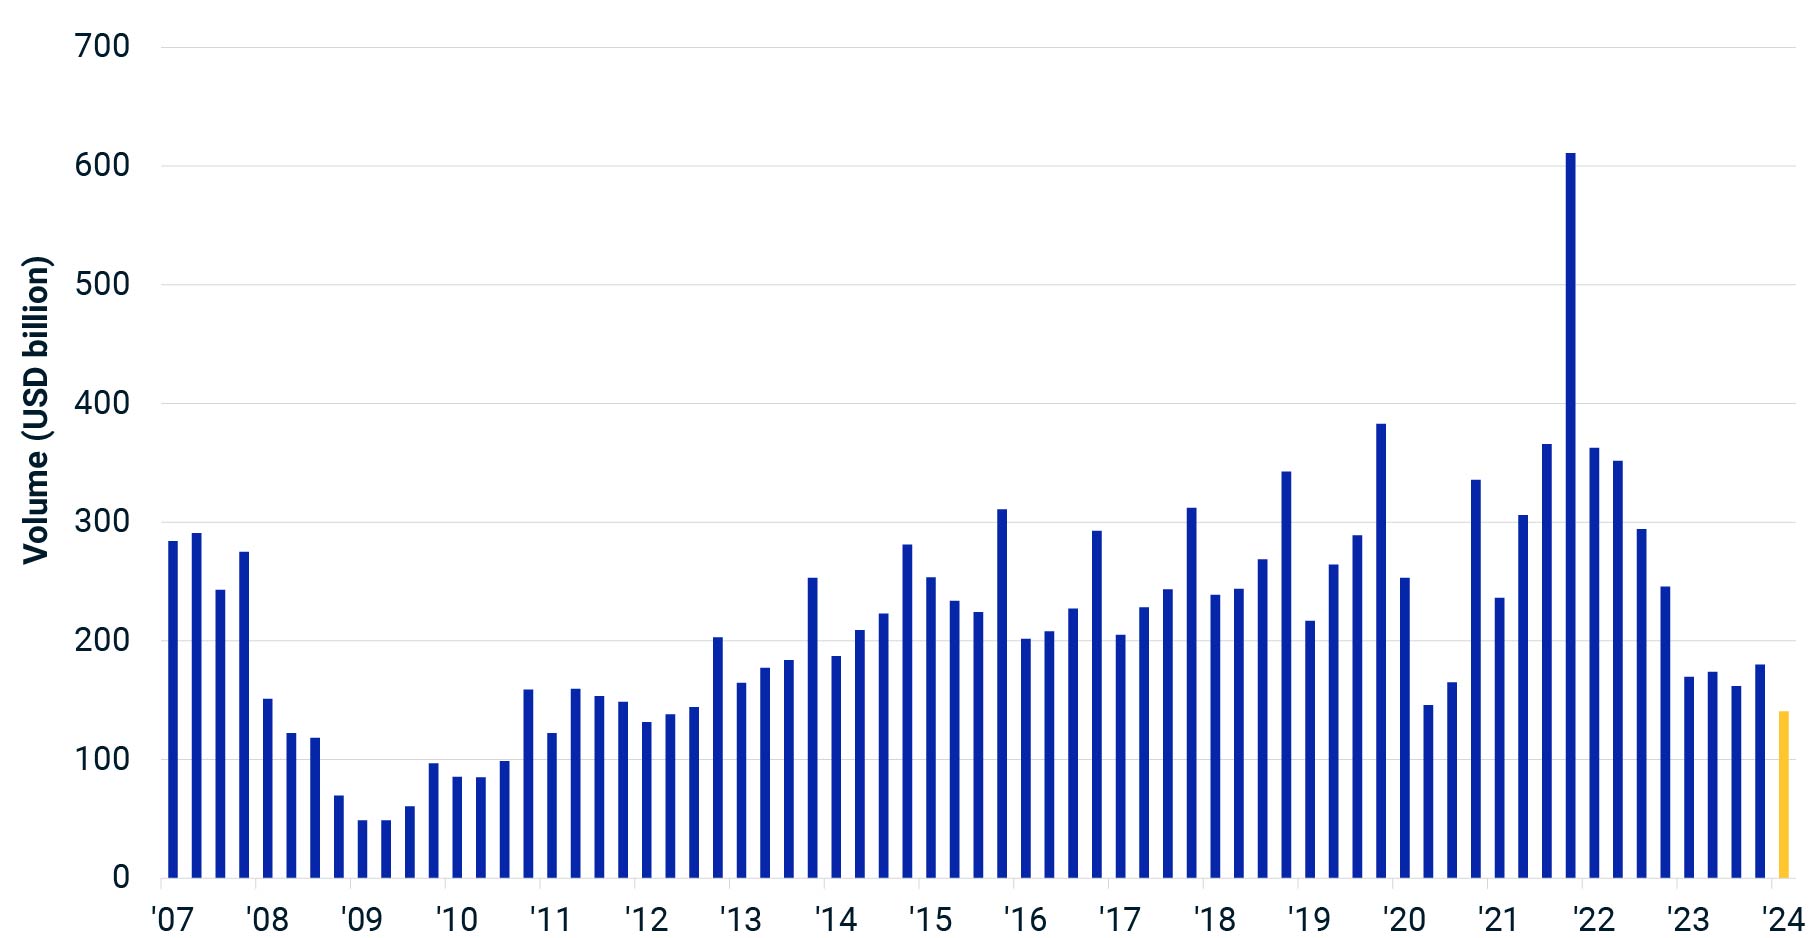
Global deal volume declined again in the first quarter of 2024, falling 17% from the same quarter in 2023 to just over USD 140 billion. This quarterly total was the lowest volume since Q2 of 2012, just weaker even than the depths of the COVID-19 pandemic. However, making such a comparison on a simple nominal basis does not account for current pricing — even after this most recent market correction, price levels today are 66% higher on a weighted-average basis than they were in early 2012. Using MSCI’s suite of hedonic price indexes to yield a volume series in constant Q1 2024 price levels, we must go back further — to Q2 of 2010 — to reach a weaker quarter. By either yardstick, current levels of market activity are still very muted.
Deal activity still weak

Looking beyond real-estate private equity
While real-estate investors have been waiting on the sidelines for clear signals for when it may be prudent to dive back into the market, some have been paying more attention to potentially more attractive opportunities across the risk spectrum and capital stack during this period of heightened uncertainty. Real-estate debt has attracted a lot of attention from investors in recent times due to the higher-interest-rate environment and the perception of more-stable returns in an environment of falling values.
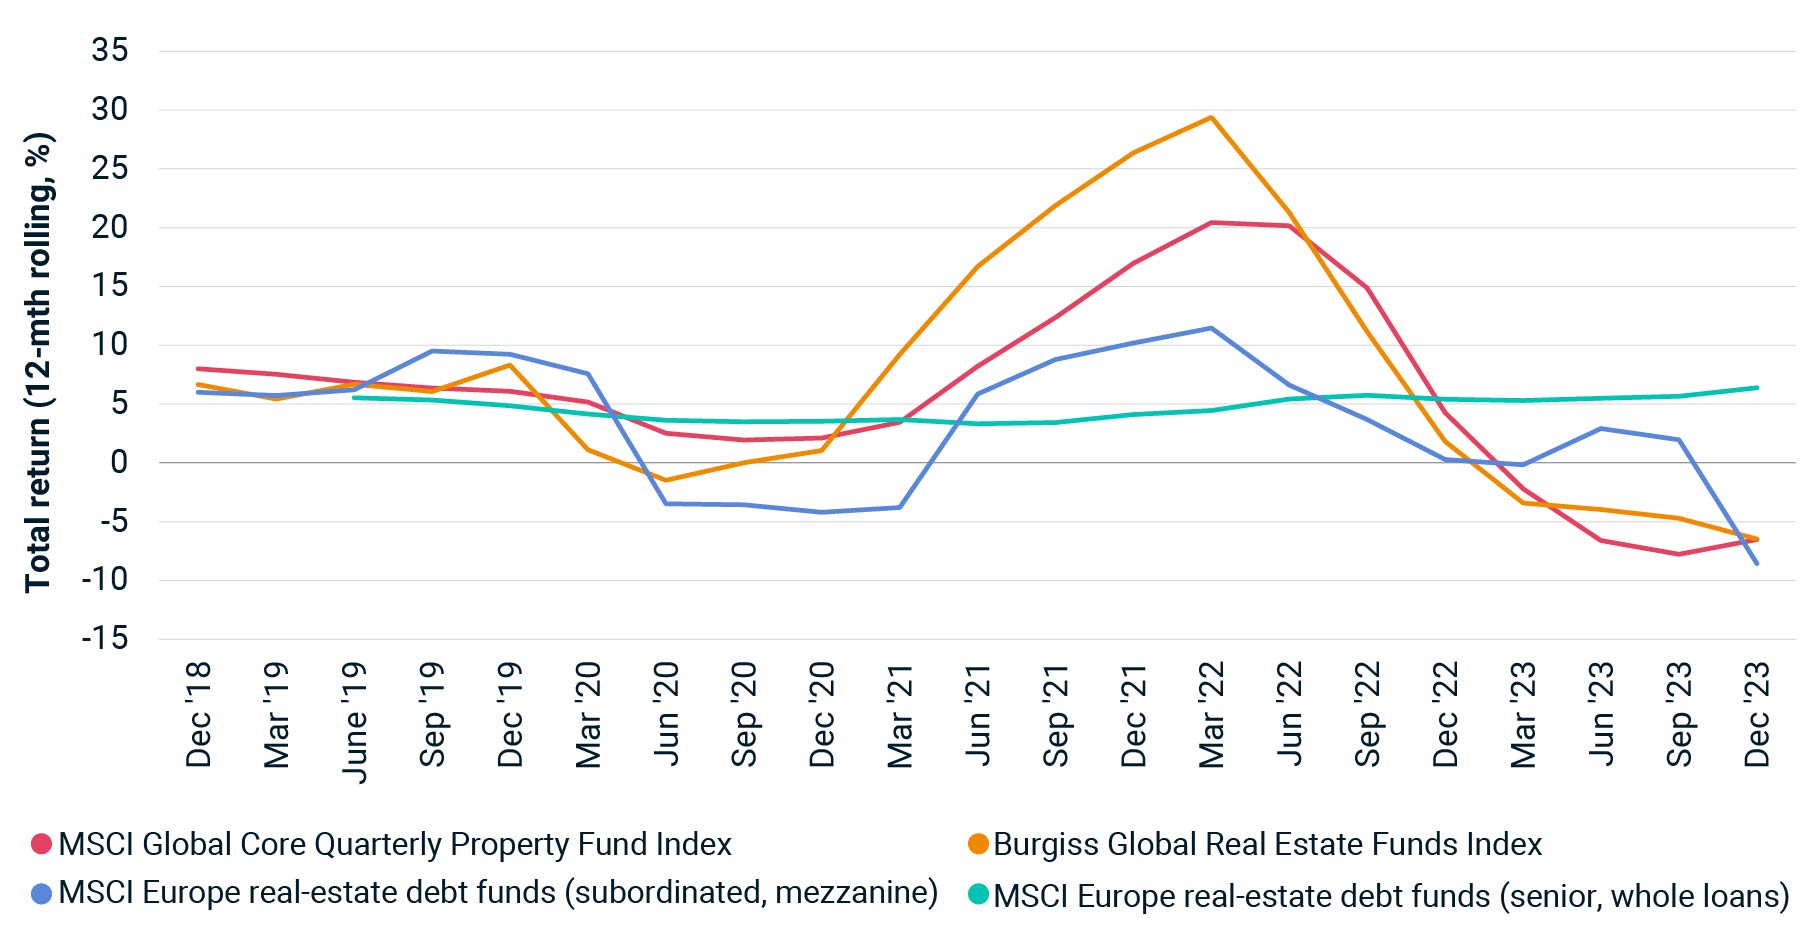
The notion of more-stable returns is borne out by the preliminary results for senior-debt and whole-loan funds in MSCI’s European debt-fund index, which is currently in development. However, the performance of funds focused on mezzanine debt and subordinated loans has been poorer, suffering negative returns in the final quarter of 2023, but also performing more negatively than both the core, open-end real-estate equity funds in the MSCI Global Core Quarterly Property Fund Index and the closed-end funds (more typically value-add and opportunistic) in the Burgiss Global Real Estate Funds Index.
Performance across strategies

Closing the pricing gap
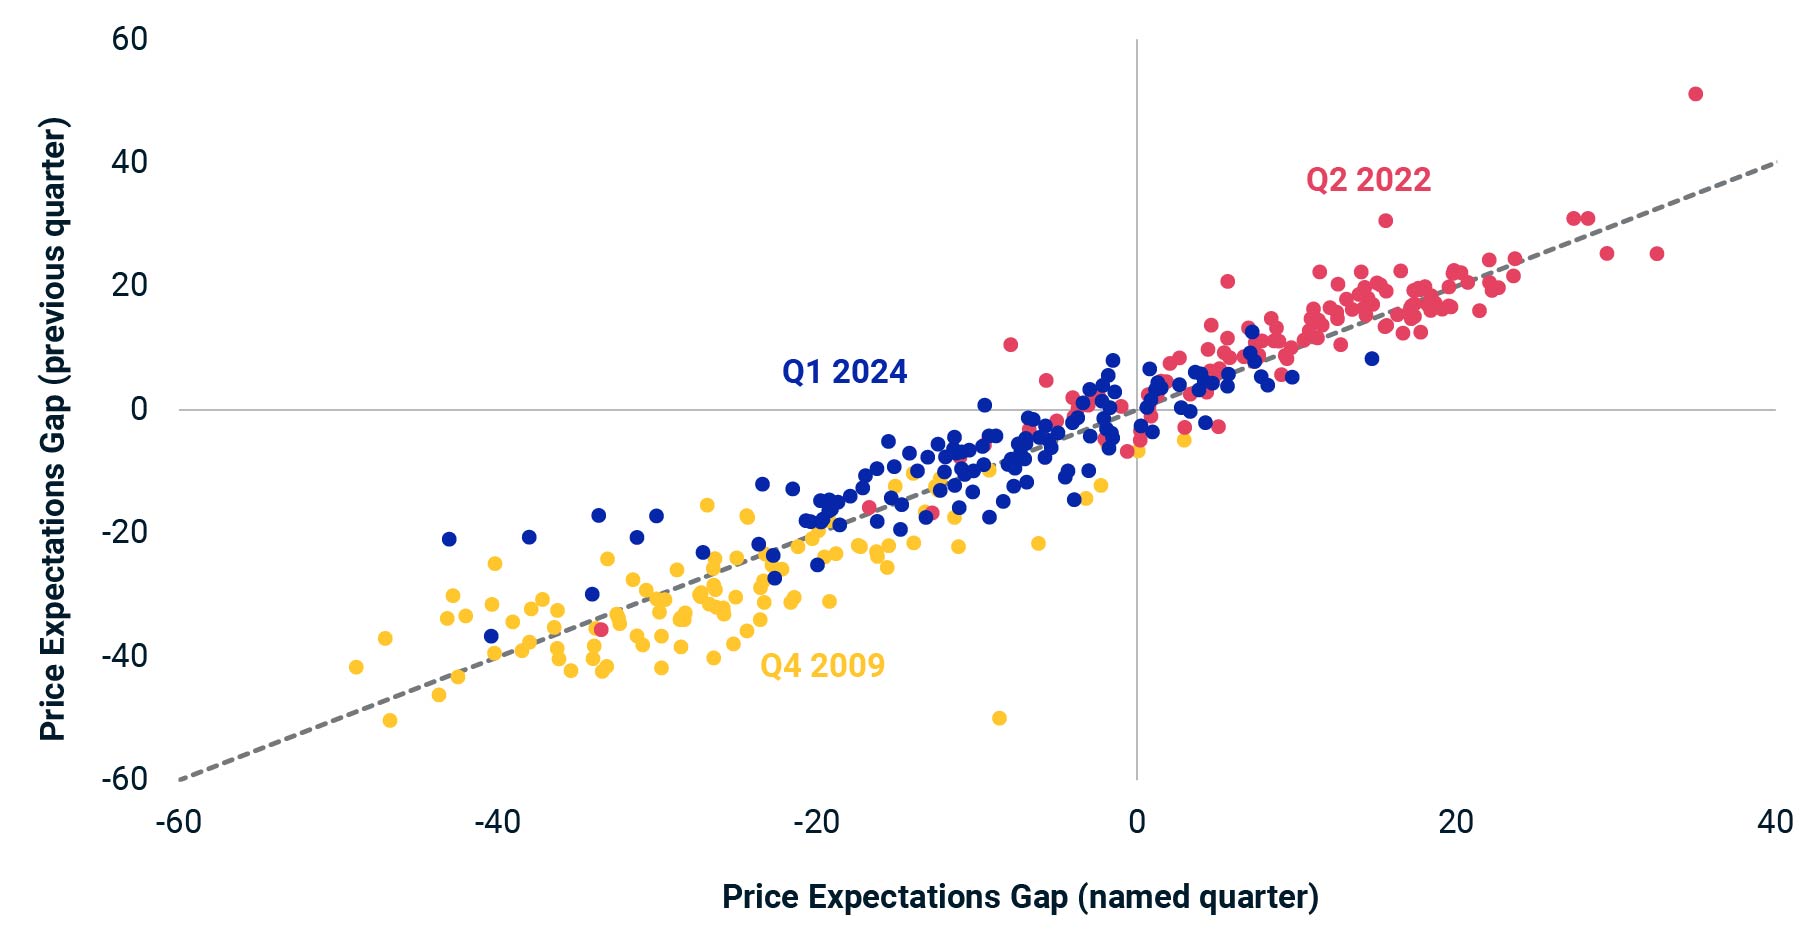
To reinvigorate activity in the real-estate equity market, prospective buyers and sellers would need to become more aligned on pricing. Markets experience low transaction activity when there is significant pricing disagreement between players, a disparity that is modeled by the MSCI Price Expectations Gap. In booming markets, buyers are eager to acquire assets, willing to pay more than sellers expect, leading to a positive reading. This was the case for most market and property-type combinations in Q2 of 2022, at the global peak in capital values.
A highly negative reading of the price gap indicates weak market conditions, where buyers expect to pay much less than sellers are willing to accept. This is the case for Q1 of 2024, which is illustrated by the blue dots in the scatter chart. The vast majority are still in negative territory — some, very significantly. However, there are a growing number of market segments for which the gap has narrowed relative to the previous quarter, and a handful are even now in positive territory, which could be an encouraging signal.
Some improvement on price positions

Signposts from listed markets
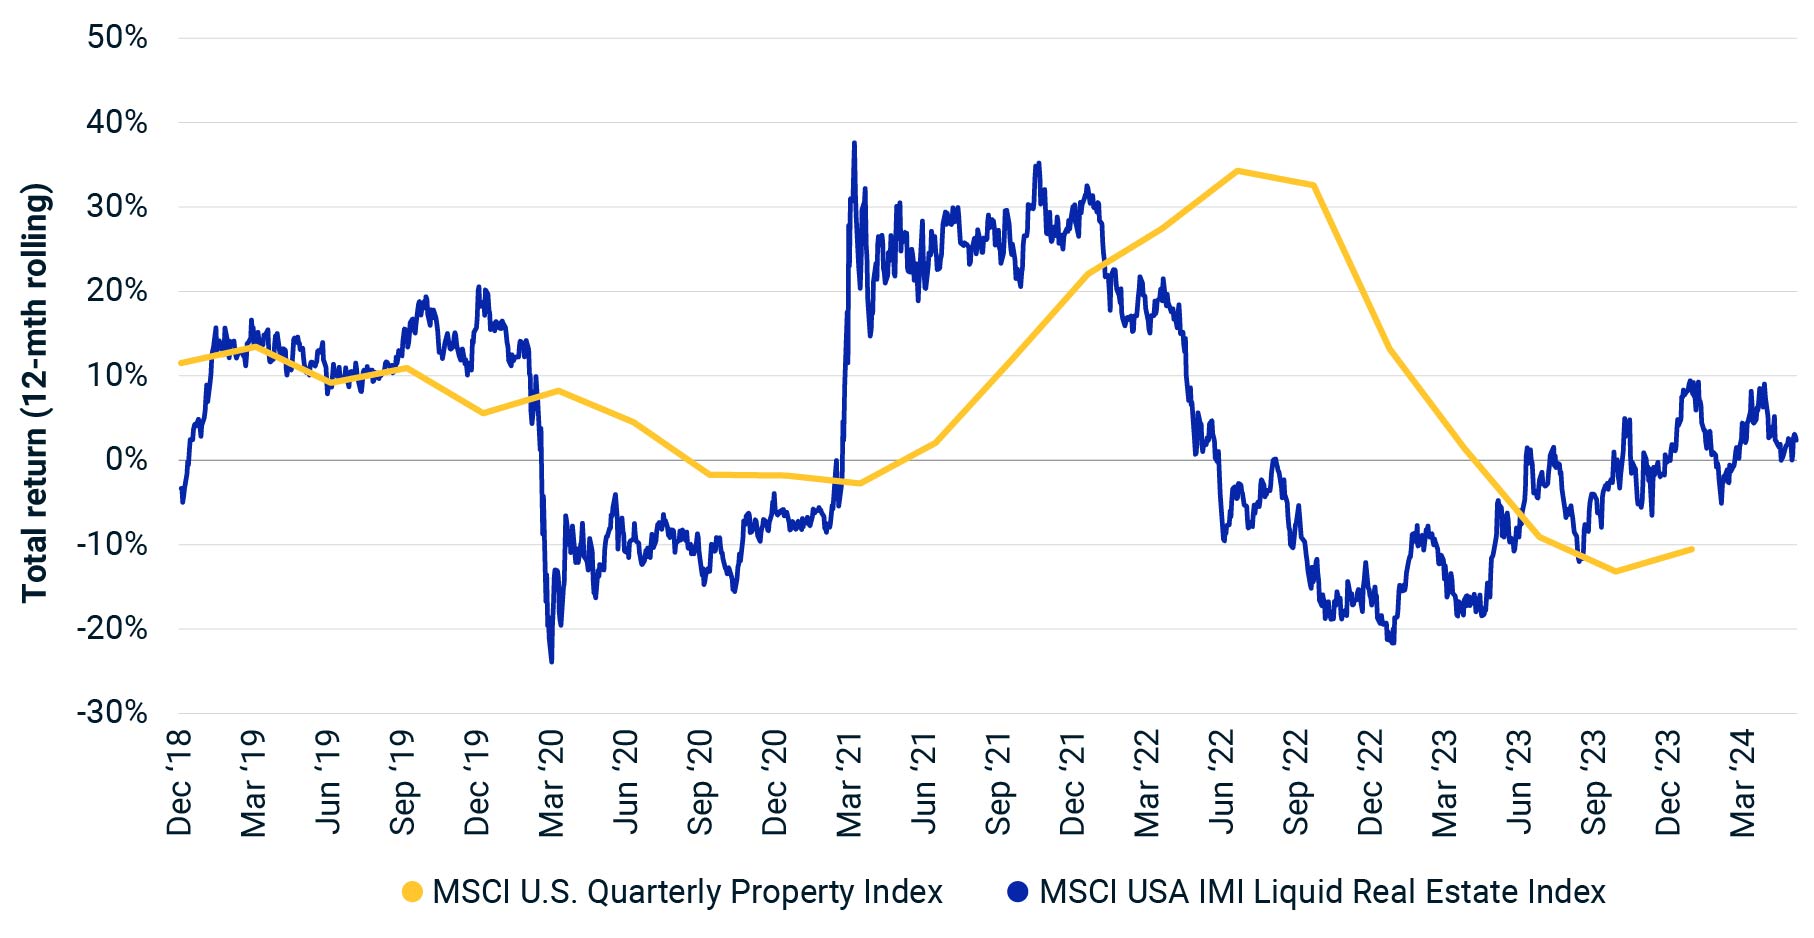
For a more positive signal one may look to listed-market information, where forward-looking sentiment is more efficiently assimilated into asset pricing on a daily basis. MSCI’s Liquid Real Estate Indexes adjust for the impact of company leverage and broader equity-market volatility, with the aim of showing what listed-market pricing implies for the underlying real-estate-asset performance.
Comparing the performance of public and private real estate in this way helps to highlight the leading signals from listed markets while removing some of the noise. U.S. data, as shown in the chart, illustrates a general upward trend in rolling 12-month returns since the end of 2022. The broad upswing in the liquid index has come in fits and starts as forecasts on U.S. interest-rate policy have been revised, but optimists could take the trend as a positive signal.
Public markets have turned positive

While we may still have some road yet to run before we reach a recovery in real-estate markets, monitoring a wide range of data sourced from across the investment spectrum can help provide waypoints as we navigate the remainder of the journey.

