- There is no one correct measure of property-market pricing because the assets that constitute a market are heterogenous.
- Analyzing a range of pricing, valuation and liquidity metrics gives investors a more comprehensive view, which is especially important in the current period of market uncertainty.
- Using the U.K. office market as an example, we find the fall in transaction prices has been smaller than that for asset values and listed property prices, in part because of the illiquidity of the transaction market.
There is no one “correct” measure of property-market pricing. Real estate is a heterogenous asset and a myriad of factors influence the price a buyer is willing to pay for a building. This presents a challenge when it comes to gauging property-market prices and values because, by their nature, every market-level measure includes a wide variety of buildings, each qualitatively different from the other. Different MSCI approaches have their own nuances, each providing a piece of the puzzle which when taken together can create a more complete view of market pricing.
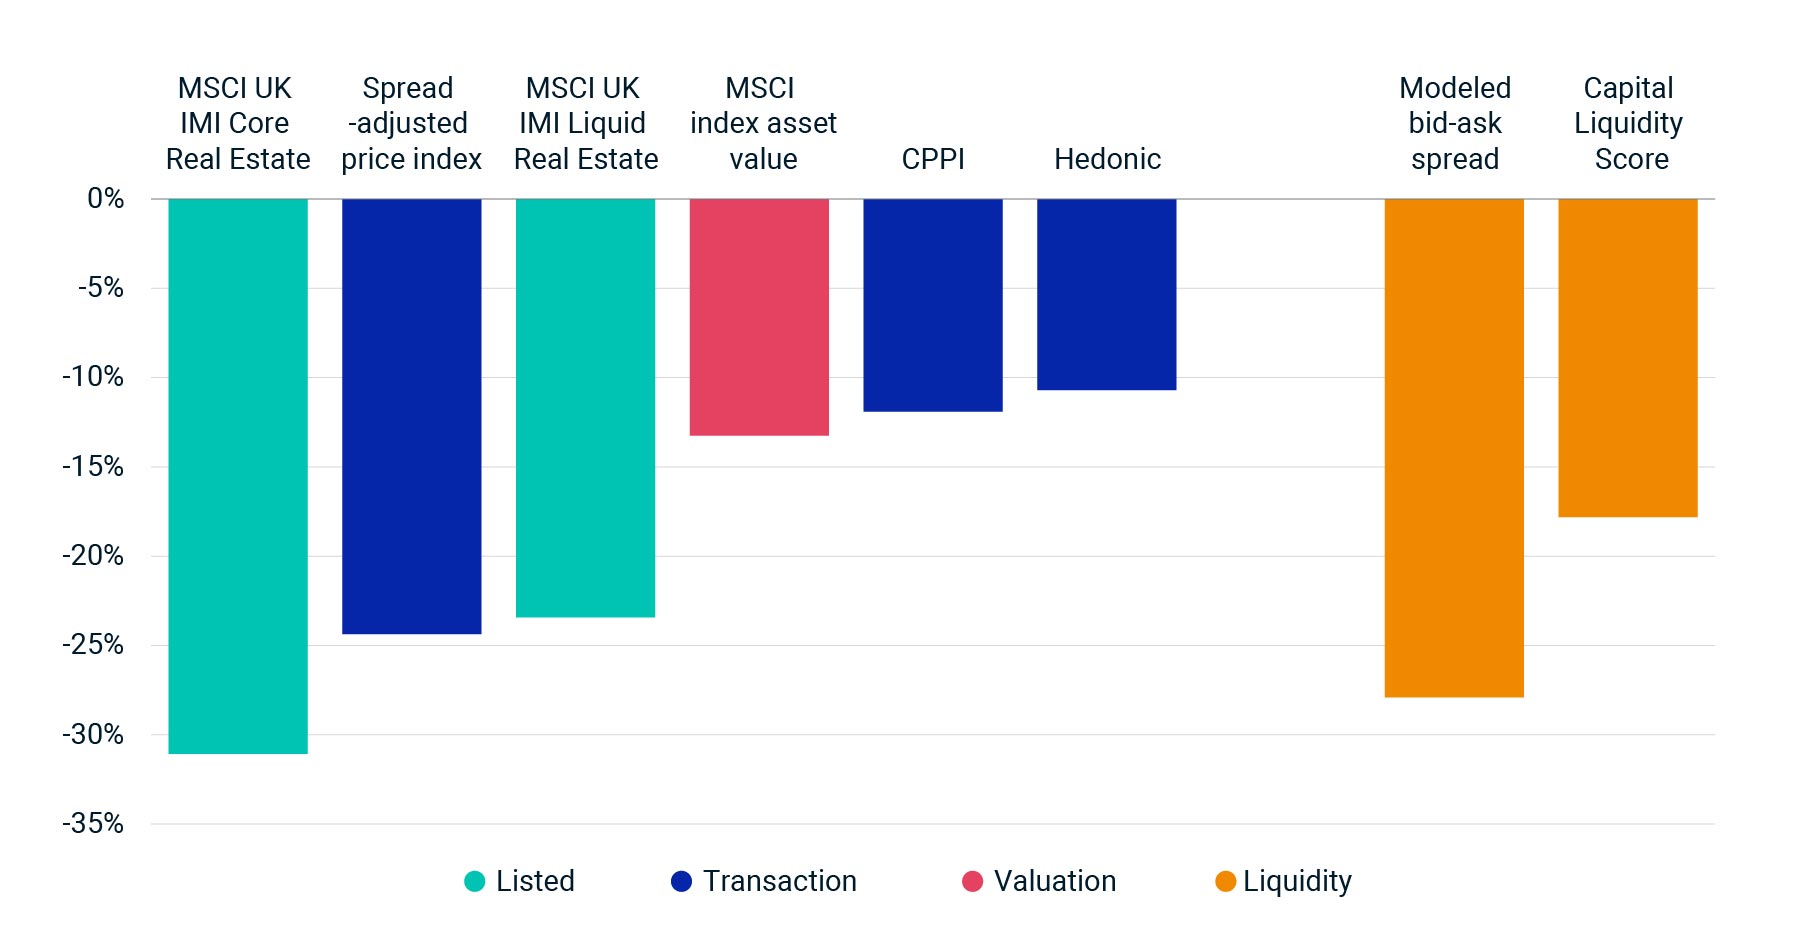
In the exhibit below we show a range of market pricing, valuation and liquidity metrics tracking the downturn in the U.K. office market in the last 12 months. They all show some degree of slowdown, but the magnitude of this slowdown differs, and each tells a valuable part of the story about how U.K. offices have been affected by the new higher-interest-rate regime.
Approaches from transactions
The RCA Commercial Property Price Indexes (RCA CPPITM) and RCA Hedonic Series are measures of transaction prices and both show a modest decline in the 12 months through March 2023. The CPPI utilizes a repeat-sales regression methodology, while the Hedonic Series is a modeled transaction-price series that controls for some of the factors that influence property pricing, such as the age, size and location of a building.
The declines are modest, in part because the transaction market has become highly illiquid and the assets that are trading tend to be better quality, thus limiting the scope for wider price falls. A larger spread of assets would have to trade for a greater drop to materialize, which may happen if buildings are forced onto the market because of distress and refinancing challenges.
Pricing, valuation and liquidity, first quarter 2023

All measures except bid-ask spread show year-over-year change as of March 2023. MSCI index asset value uses the MSCI UK Quarterly Property Index. Listed measures show all property types; other measures show office market only. Liquidity score (from Capital Liquidity Scores®) shows an average of scores for individual U.K. markets.
Market illiquidity can be quantified with two MSCI measures, as shown by the orange bars. The liquidity score, which measures the depth and breadth of capital actively acquiring assets, fell close to 20% in the 12 months through March for U.K. offices. A modeled bid-ask spread, which estimates the gap between buyer and seller reserve prices using a model drawing on transaction data, shows a significant disconnect between where buyers think UK office market pricing should be and where sellers are willing to trade.
We also combined the modeled bid-ask spread and the CPPI to create a spread-adjusted transaction price index, which illustrates a much bigger fall than the actual CPPI. This approach shows where the market clearing price would be if prices adjusted in accordance with the buyers’ reserve price and demonstrates buyers would require a bigger discount than is currently available to come back into the market and move liquidity to its long-run average, according to our model. Prices have not shifted that much so the market remains illiquid, with a substantial gap between buyers and sellers.
More pieces of the puzzle
Another source of intelligence is the valuation data from the MSCI UK Quarterly Property Index, which shows a drop in asset values greater than that indicated by the transaction-price data. The disparity is attributable to the willingness of valuers to down-value assets more aggressively in the face of rapidly rising interest rates and the higher cost of capital.
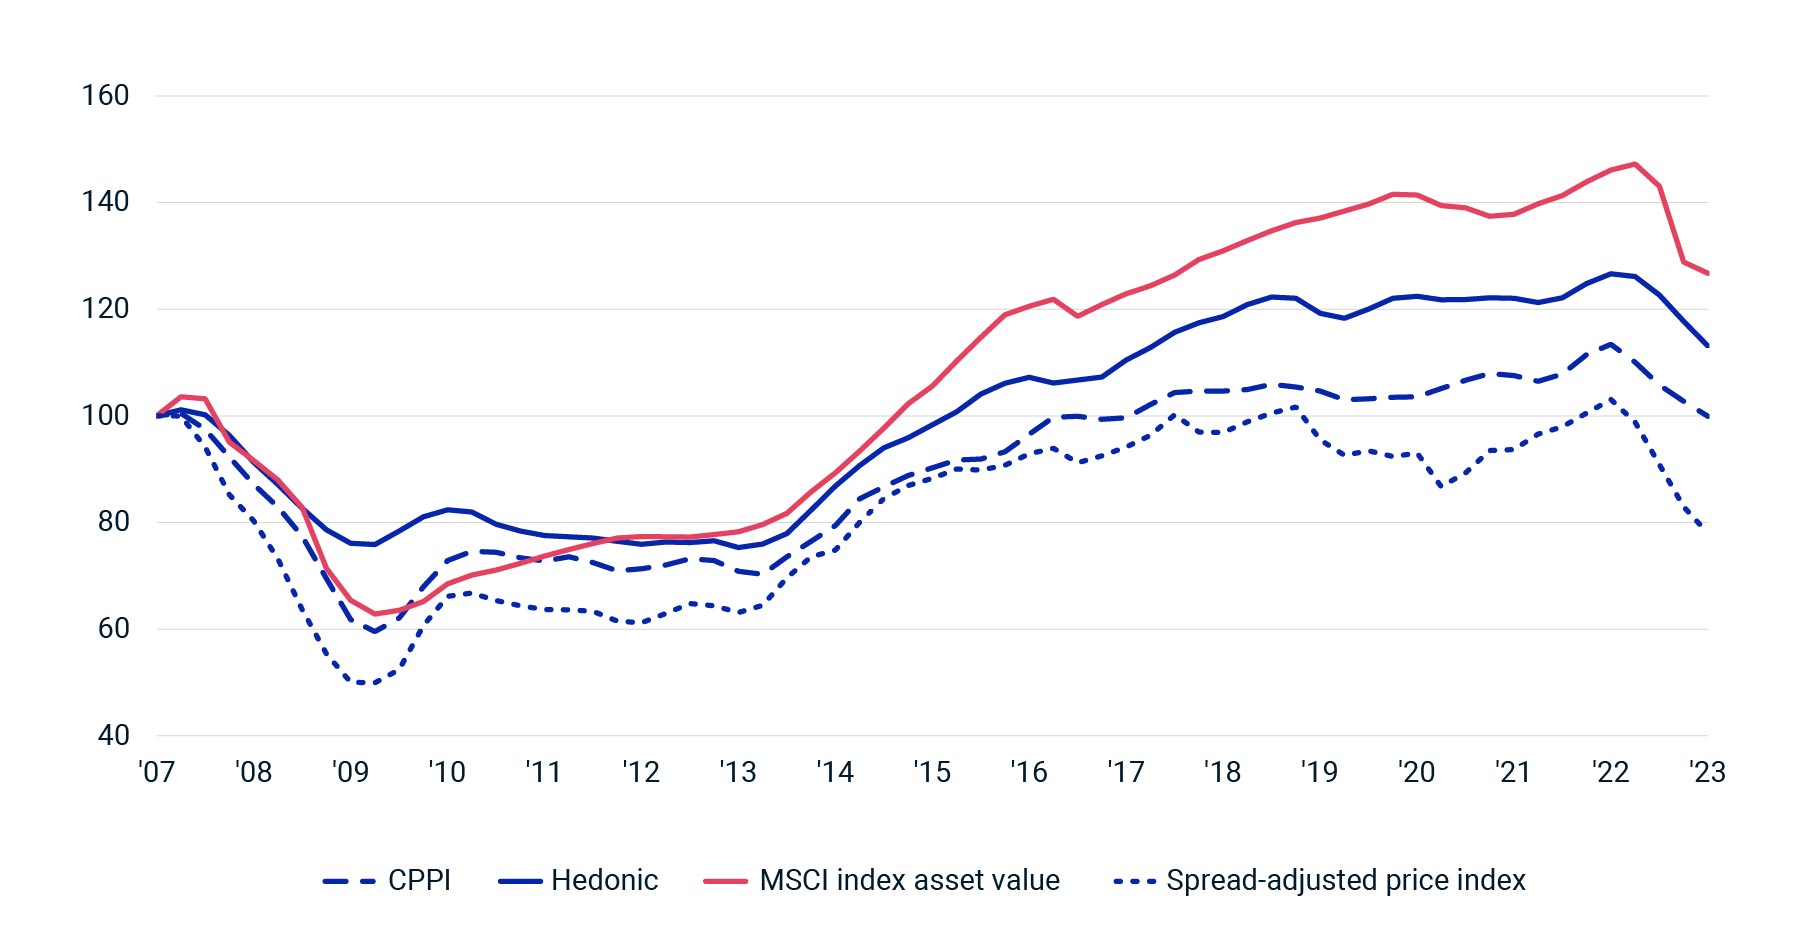
U.K. office pricing and valuation trends since 2007

Indexed, Q1 2007 = 100. Index asset value uses the MSCI UK Quarterly Property Index.
The final piece of the puzzle is what the performance of the listed property companies can tell us. The listed sector provides a different perspective on property-market pricing and in some circumstances can be a leading indicator for the direct market. Through March, the MSCI UK IMI Core Real Estate Index (which captures all asset types) was down significantly over the prior 12 months. The inherent volatility in listed versus private markets means the shifts in pricing are often more aggressive. For example, the peak-to-trough decline in the listed index during February and March 2020, at the onset of the pandemic, was more than 40%. This drop was not reflected in direct market pricing or valuations, which barely moved.
The higher volatility is due in part to embedded leverage used by listed real-estate companies to finance their assets as well as to exposure to broader equity market beta. The MSCI UK IMI Liquid Real Estate Index methodology is designed to negate these impacts. The drawdown in the 12 months through the end of March was more muted than the core index, sitting just behind the fall in the liquidity-adjusted CPPI (as shown in the first exhibit).
A global view
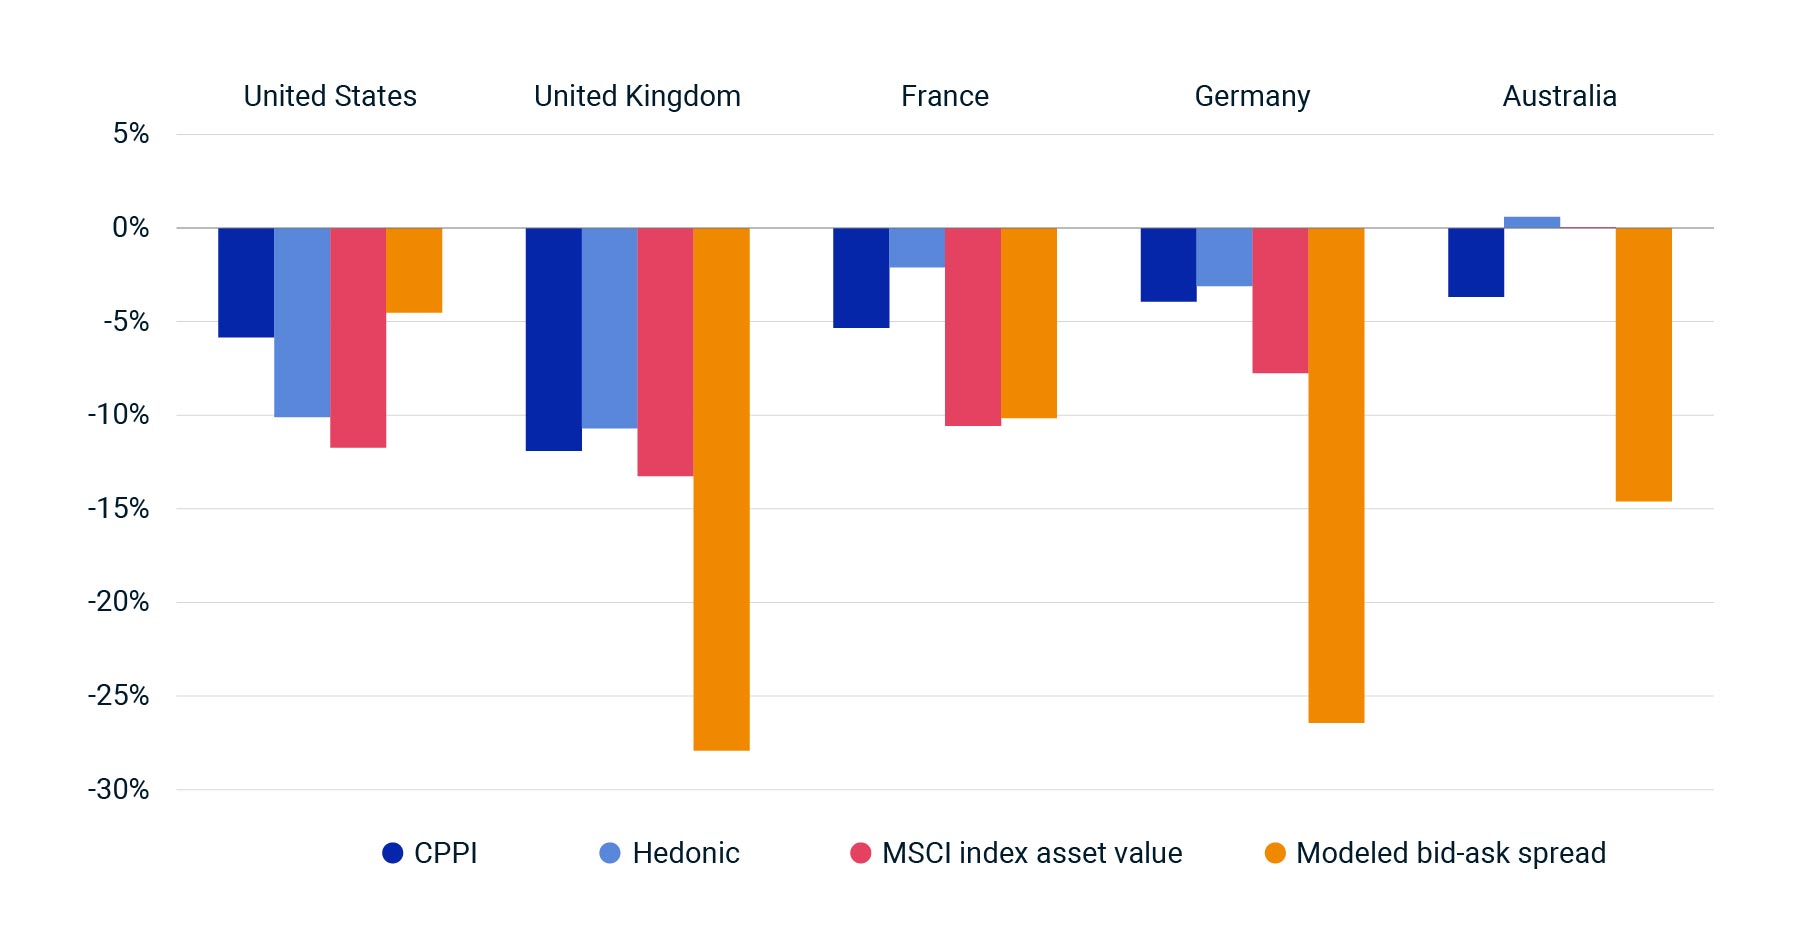
The wide range of pricing outcomes is not particular to the U.K. Data from other developed office markets illustrated a similar trend. Broadly, the hedonic and CPPI series (using transaction data) showed a smaller adjustment in prices when compared with the valuation data and liquidity (as measured by the capital liquidity scores and the modeled bid-ask spread).
One outlier was the U.S., where the drop in the hedonic prices over the last 12 months was substantial when compared to the bid-ask spread. This disparity suggests that assets in a wider price range were selling in the U.S. compared to the U.K. or Germany, for example.
International office market comparisons, first quarter 2023

CPPI, hedonic and index asset value shows year-over-year change. Index asset value uses the MSCI Global Quarterly Property Index.
These MSCI pricing, valuation and liquidity measures mean investors can avail of a more rounded view of the global real estate market as they assess risk and opportunity. This becomes even more vital at times of uncertainty and illiquidity, when corrections in pricing and valuations have tended to run at a different pace.
The author thanks Will Robson for his contribution to this post.
