Investors do not like to crystallize losses, and loss aversion is an observed phenomenon in commercial-property markets.[1] Broadly, owners tend to sell winners, but hold onto losers, as they are less willing to take a loss on a prior investment.
This fact becomes more important when aggregate property prices start to correct, and the tendency toward loss aversion has important implications for market liquidity. It can provide some explanation for both the current illiquidity in global markets in general and the variation in that illiquidity city by city.
Higher rates, fewer transactions, lower property values
The rapid rise in interest rates since the first half of 2022 has led to a sharp drop in transaction volumes and an ongoing correction in valuation and pricing metrics across many of the world’s largest property markets. By analyzing price movements to June 2023 using the RCA CPPI, and combining the price changes with the hold period for properties, we can quantify what percentage of buildings may be worth less than the owner originally paid through a mark-to-market exercise.
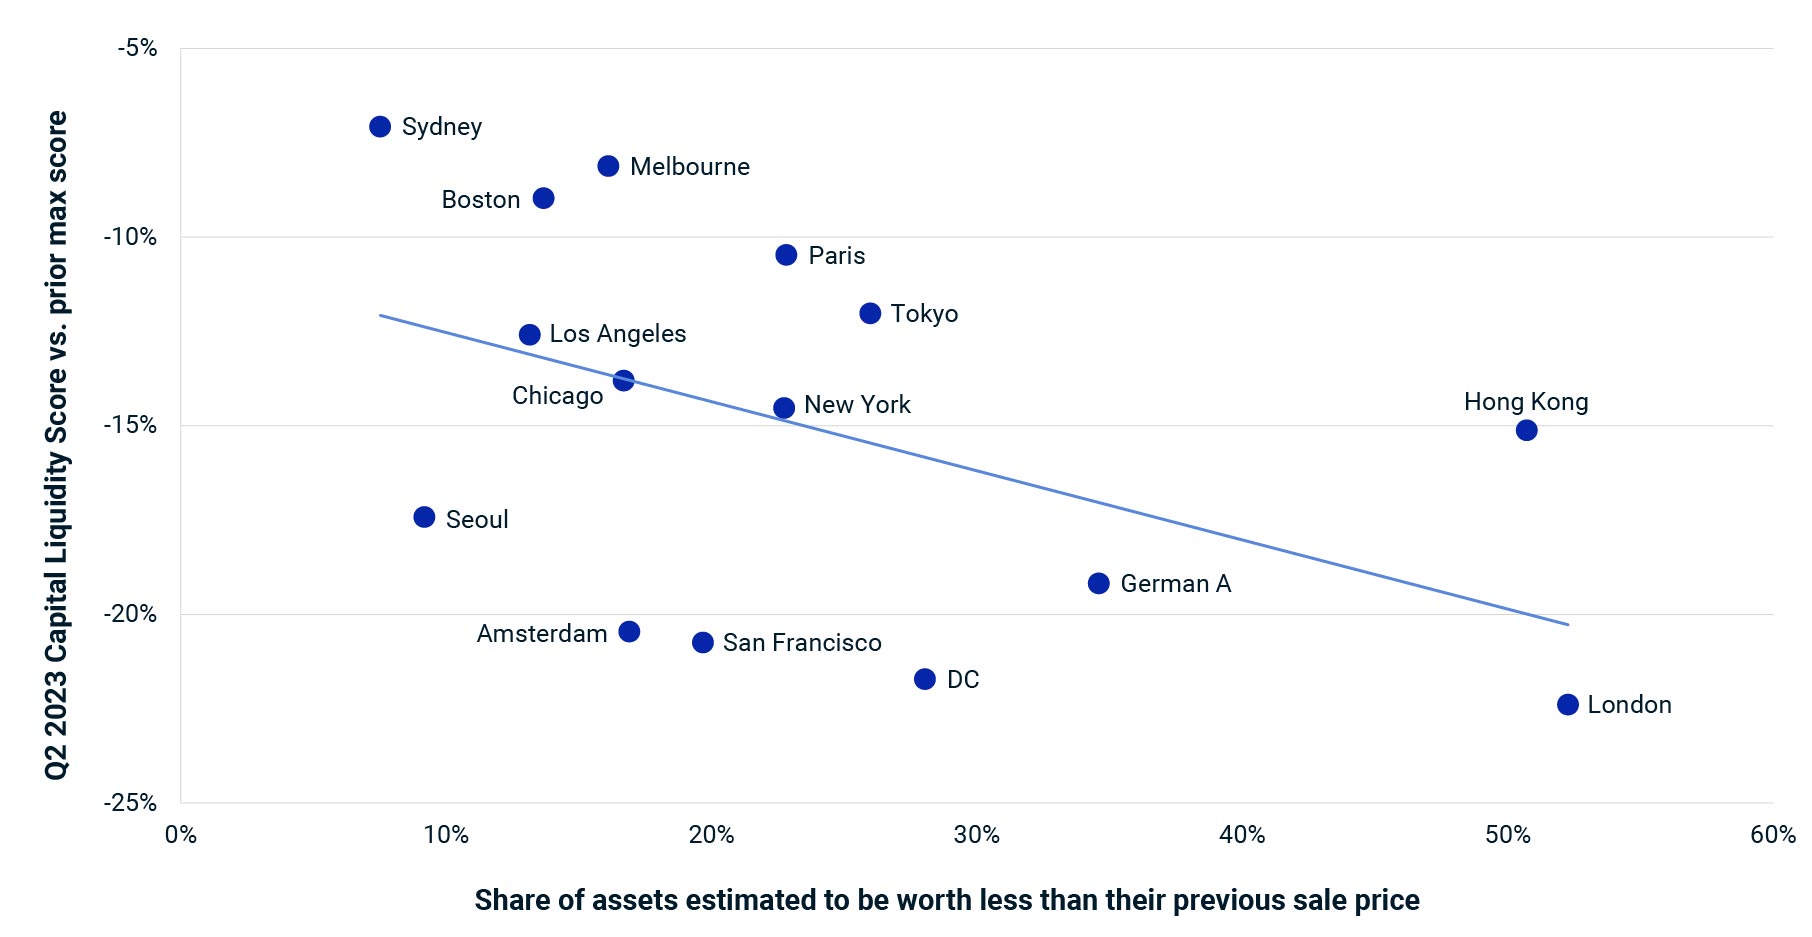
London and Hong Kong are the worst-placed of the global cities analyzed on this measure, with more than 50% of assets estimated to be worth less than their last acquisition price. In London, commercial-property prices have fallen to levels last seen in 2017, with a large amount of stock acquired by property investors since then, according to MSCI transaction data. In contrast, markets like Sydney, Seoul and Melbourne look better-placed because of the high rate of price growth through the cycle and a very modest correction thus far: In Sydney, the 10-year compound annual growth rate (CAGR) to June 2023 is 10.5%, in Seoul 8.2% and in Melbourne 7.4%.
Markets with a greater proportion of assets in the red have had larger drops in liquidity

To assess the impact that the tendency toward loss aversion has on market liquidity, we can combine the data showing what percentage of properties is estimated to be in the red in each city with MSCI Capital Liquidity Scores. There are outliers among the global markets analyzed; but, broadly, the more properties estimated to be in the red, the less liquid the transaction market. For example, London’s Capital Liquidity Score is down by more than 20% versus the 2015 peak — and by 15% in the last 12 months alone. Meanwhile, fewer assets are estimated to be out of the money in Sydney, Melbourne and Boston, and liquidity has held up better in those cities.
Of the office properties sold in central London this year, and where we have a valid prior price, only six of the 21 trades were at a cash loss. This emphasizes how the trading activity taking place is oriented toward the better-quality assets, with owners potentially unwilling to take a loss by selling lower-quality buildings.
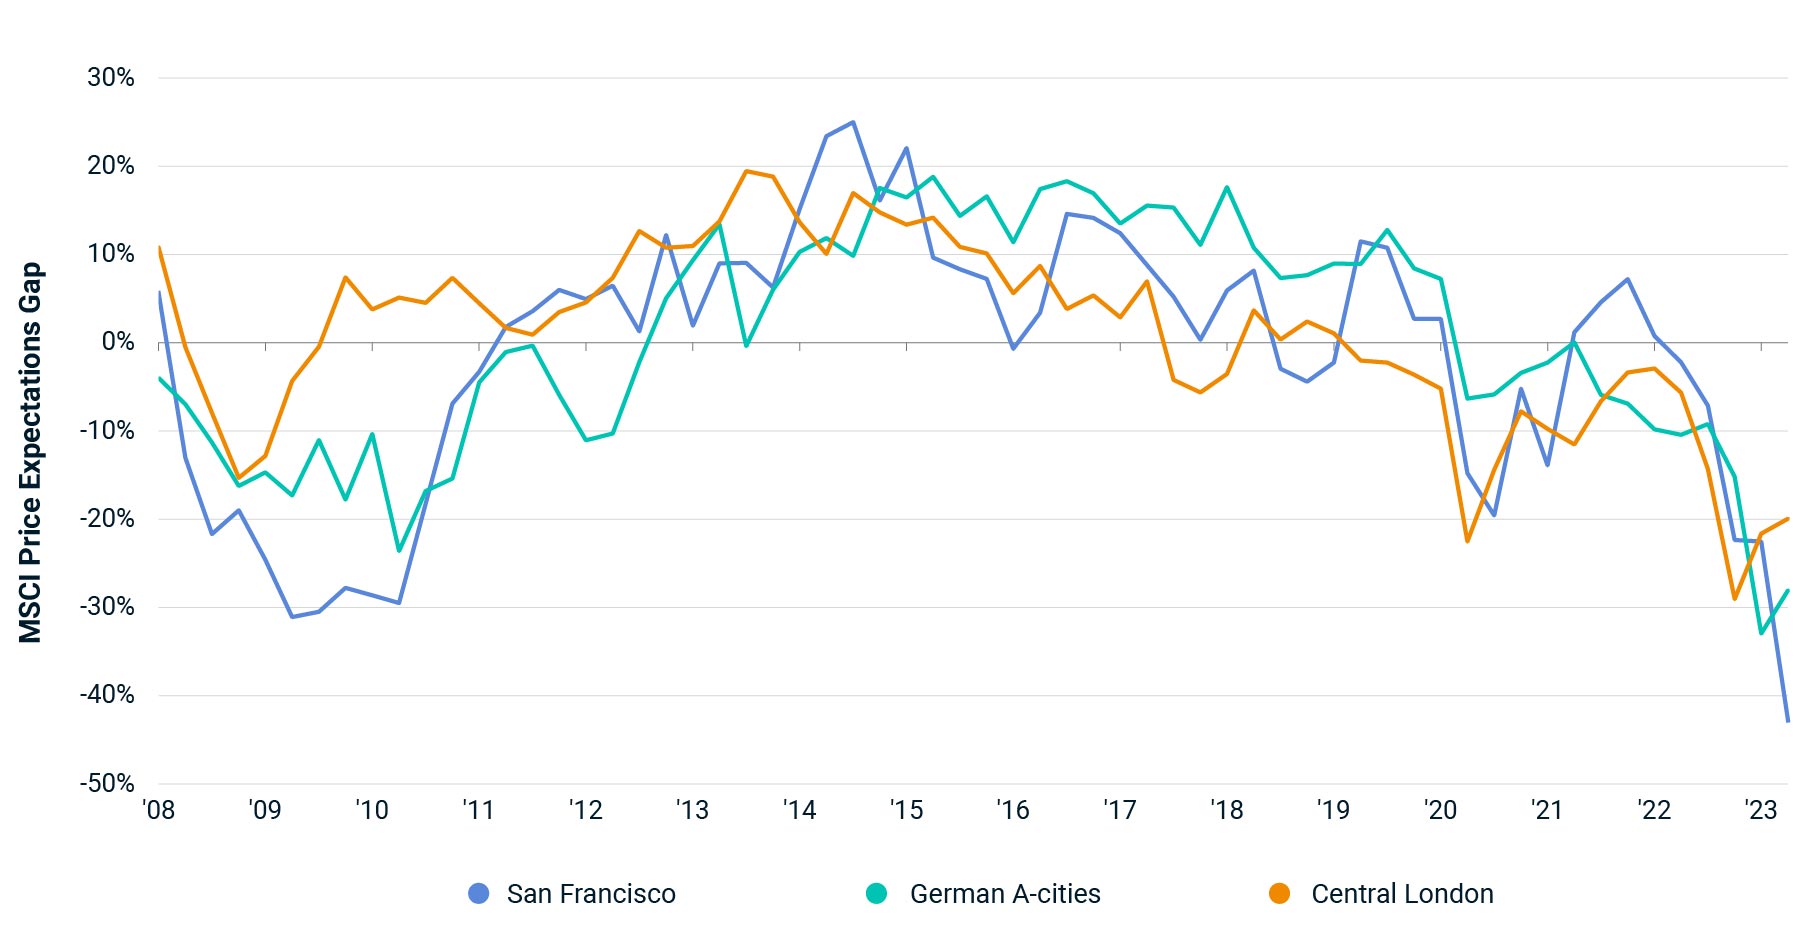
We know also from the MSCI Price Expectations Gap that there is a significant difference in the amount buyers are willing to pay for a building and the price at which sellers are willing to trade. This modeled gap is largest in markets like London, the German A-cities and San Francisco. The MSCI Price Expectations Gap provides another way of illustrating the tendency toward loss aversion: Sellers anchor on prior prices, and so liquidity dries up when buyers shift their price expectations more rapidly during periods of uncertainty.
Buyers and sellers have moved apart on price expectations for offices

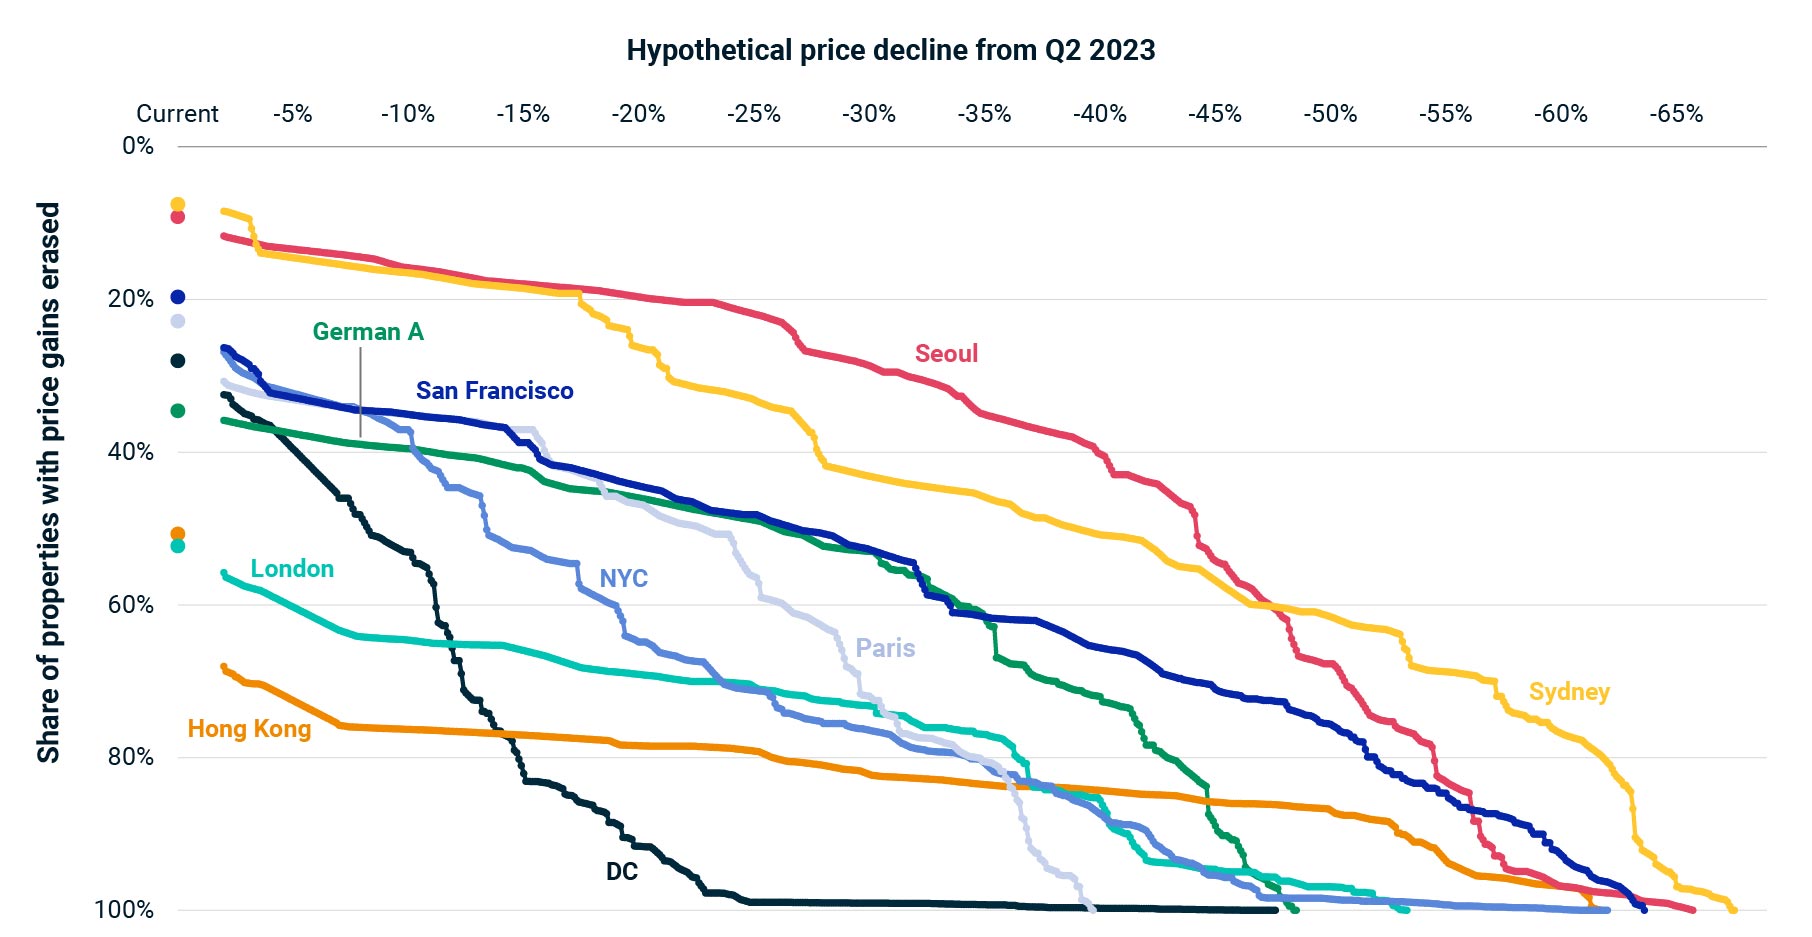
We can extend the loss-aversion analysis by taking the current percentage of properties estimated to be in the red and looking at how this would change in the event of further price falls. For example, if prices dropped by another 15% in Washington, DC, that would mean more than 80% of owners could be sitting on paper losses, while a drop of 25% would affect 99% of assets. This broad impact is because of lackluster price growth in DC since the end of the 2008 global financial crisis — a 10-year CAGR of just 2.5% makes DC the worst performer of the global cities analyzed here. Similarly, a hypothetical price drop of 13% in New York would result in more than 50% of assets potentially worth less than they were acquired for.
Scenarios on price declines spell bigger impact on some markets

There is an important caveat to this analysis: Pricing movements are calculated at the metro level and hide a myriad of variation at the property level. The factors that feed into property pricing will affect each asset to a varying degree, and investors selling property may achieve double-digit returns in London, just as they may achieve single-digit returns in Seoul or negative returns in Sydney.
With continued uncertainty over inflation and the path for interest rates and weak pricing signals coming from direct property-investment markets, however, investors should consider that the loss-aversion trend may ensure that the current period of low liquidity persists.

