- The risk of severe wildfires is expected to increase in many regions, which may lead to increased direct costs for firms with assets in affected areas.
- The majority of assets owned by MSCI ACWI Investable Market Index constituents were in areas with low current or future wildfire risk. Modeled direct costs from wildfires for these firms were projected to be relatively low.
- However, we found a high risk for assets concentrated in wildfire hotspots such as Central America and Southeast Asia.
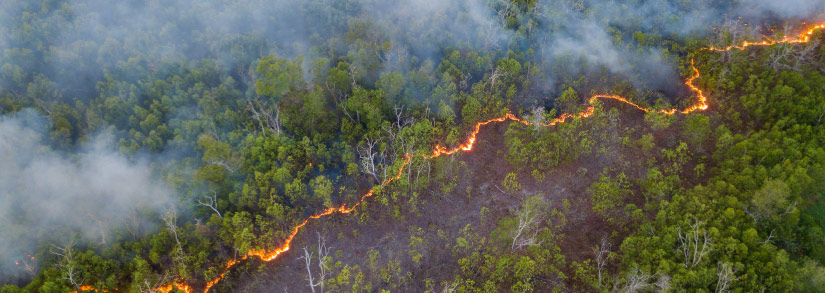
In the last two years, wildfire activity reached regional record levels in the Western U.S., Siberia, parts of Brazil, the Eastern and Central Mediterranean and North Africa.1 And the likelihood of severe wildfires is expected to increase in many places due to global warming and a higher probability of heatwaves and arid conditions. Wildfires have a significant effect on global carbon emissions2 and can potentially increase costs from physical risks for companies, making them an important consideration for investors as they manage risk in their portfolios.
The impact of wildfire on assets
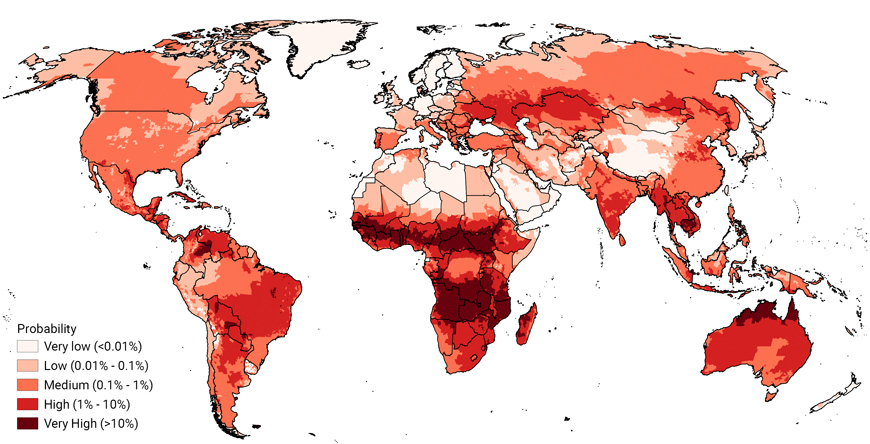
We explored how wildfire risks may change in the future, based on satellite data, climate-model projections and socioeconomic factors such as wildfire management.3 Most assets of the MSCI ACWI Investable Market Index (IMI) constituents were located in regions with low to medium wildfire probability in 2050, as shown in the exhibit below. This is mainly because assets were primarily (88%) located in urban areas,4 which tend to have a lower wildfire probability than other land-use types. However, our analysis revealed four future hotspot regions with annual fire probabilities above 1% in parts of Central America/Brazil, sub-Saharan Africa, Southeast Asia and Australia.
Wildfire probability 2050

Data as of March 23, 2022. Source: MSCI ESG Research
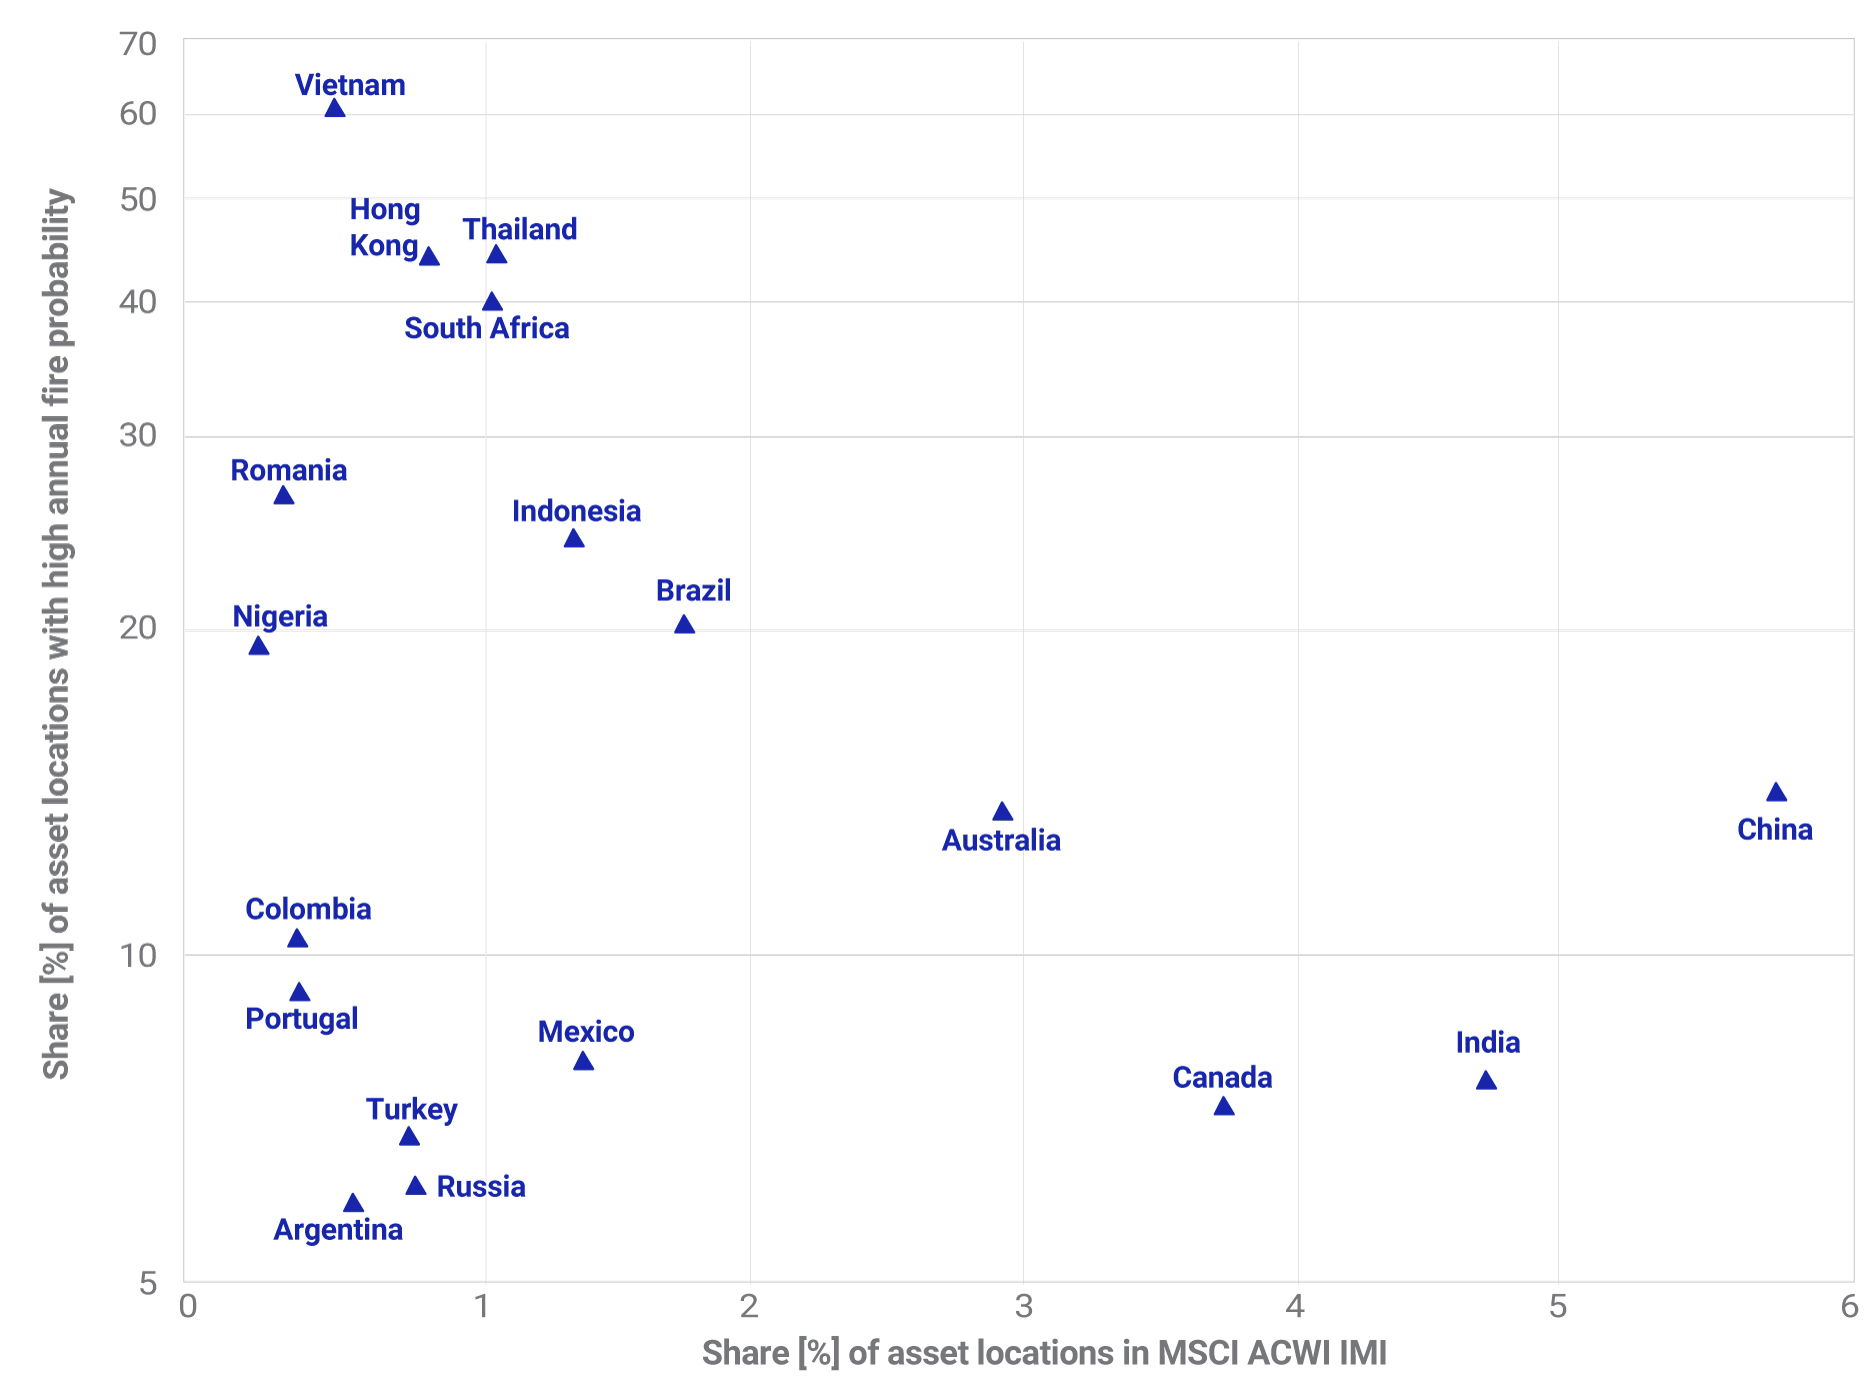
We also identified countries with a high share of assets exposed to high wildfire probability (>1%) in 2050. Among those, Vietnam, Thailand and South Africa showed a very large share of assets (> 40%) with a high risk of wildfires in 2050, as shown in the exhibit below. Companies with significant assets in those areas may be particularly exposed to future wildfire risks. In contrast, cost is driven by countries such as Brazil, Australia and China that had a larger number of asset locations in the MSCI ACWI IMI, combined with a relatively high number of assets located in high-risk areas.
Markets with assets particularly exposed to wildfire risk in 2050

Countries with a high share of assets exposed to high wildfire risk (annual wildfire probability >1%) against their share in the MSCI ACWI IMI. Only markets with more than 500 assets in the MSCI ACWI IMI are shown. Data as of April 8, 2022. Source MSCI ESG Research
Potential risks and costs through 2080
While projected wildfire probabilities are an indicator of the expected wildfire risk, investors may focus on potential costs as well as changes of risks over time. To investigate this evolution, we computed the annual average costs for all asset locations owned by MSCI ACWI IMI constituents using our Asset Location Database and our wildfire model. The model considers the annual wildfire probability, the asset’s vulnerability, the asset value and the output generated by that asset. Indirect costs such as health care, fire management and business interruption in proximity to the fire are not considered.
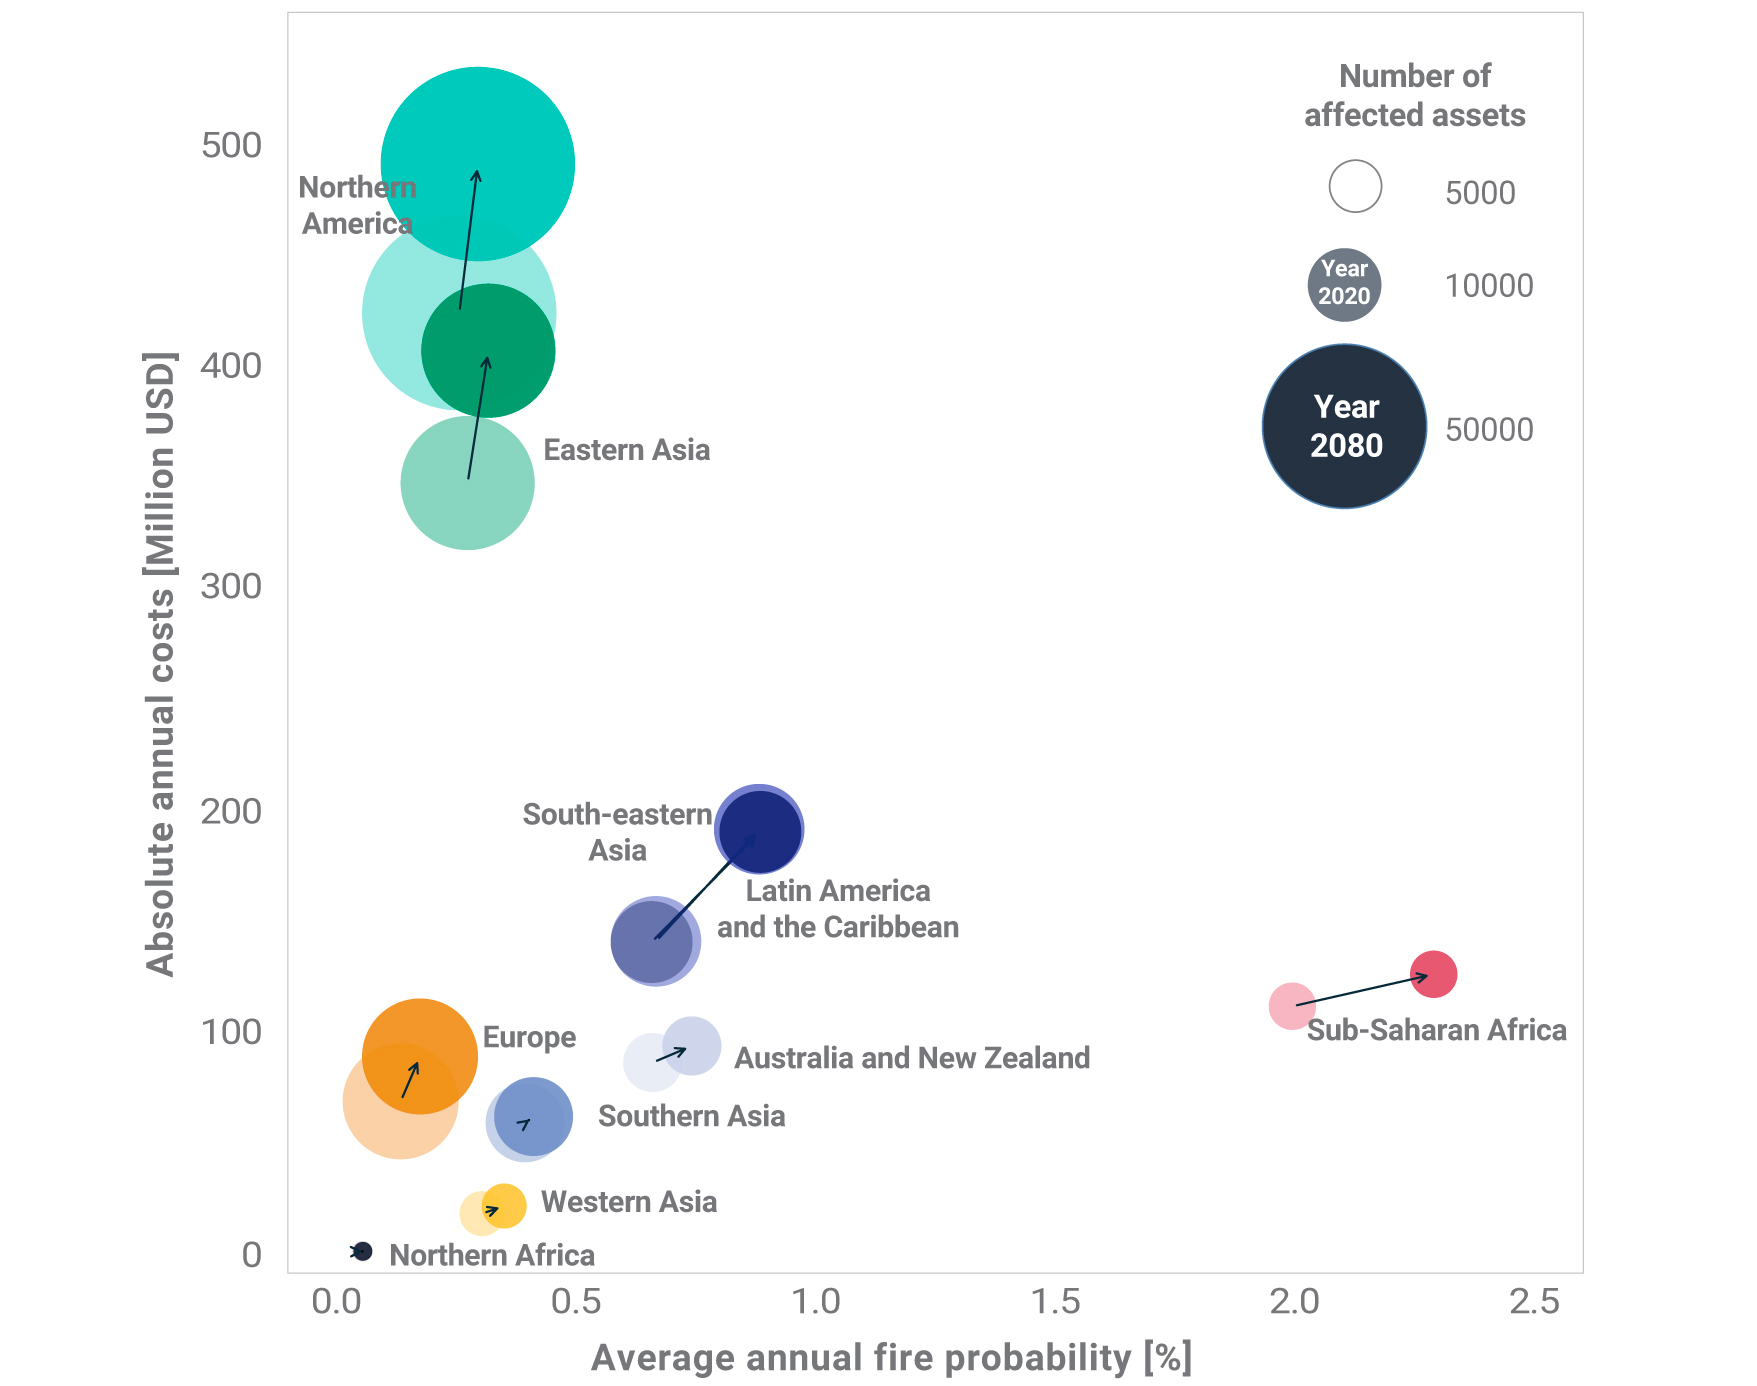
Comparing today’s wildfire probabilities with those in 2080 revealed no significant change in fire patterns. We observed a small increase in fire probability in most parts of the world, with the highest increases in sub-Saharan Africa, Latin America and the Caribbean and Southeast Asia, as shown in the exhibit below. Globally, costs from wildfire increased by 19% (+ USD 297 million) in 2080. Eastern Asia contributed most to that increase in costs (+ USD 75 million), although the increase in fire probability for this region was small (absolute + 0.04%). On the other hand, we found that sub-Saharan Africa had the highest increase in wildfire probability (absolute + 0.3%), but the expected increase in costs was relatively small, mostly due to a smaller number of assets or smaller asset value.
Increase in wildfire probability and costs until 2080

Increase in wildfire probability and costs from 2020 until 2080. The size of the bubbles reflects the number of assets per region with wildfire risks larger than 0.01% whereas bright and dark colours reflect the years 2020 and 2080, respectively. Data as of April 8, 2022. Source MSCI ESG Research.
Focus on location and impactful costs
Our analysis of projected direct costs from wildfire events showed relatively small potential average costs per asset and MSCI ACWI IMI constituent, but costs may be potentially devastating if assets are concentrated in a hotspot region. Thus, investors may want to focus on location and the potential for impactful wildfire events when considering regional risk profiles.
1Copernicus Atmospheric Monitoring Service. 2021. “Wildfires wreaked havoc in 2021”.
2Copernicus Atmospheric Monitoring Service. 2020. “How wildfires in the Americas and tropical Africa in 2020 compared to previous years”.
3Copernicus: 2021 saw widespread wildfire devastation and new regional emission records broken. https://atmosphere.copernicus.eu/copernicus-2021-saw-widespread-wildfire-devastation-and-new-regional-emission-records-broken
4Wildfire Risk Estimation Methodology. September 2021. MSCI ESG Research LLC.
5MSCI ESG Research based on Copernicus Global Land Cover Layers and MSCI’s Asset Location Database.
Further Reading
Identifying Emerging “Hot Spots” for Physical Risk in the US
