- Global equities were down in Q1 2022, with the MSCI Enhanced Value, MSCI High Dividend Yield and MSCI Minimum Volatility Indexes leading in terms of active performance among the MSCI Factor Indexes.
- We look at how factor indexes have performed during military conflicts, as we seek to understand the potential effects of the Russia-Ukraine war, and how the minimum-volatility index has performed since the invasion.
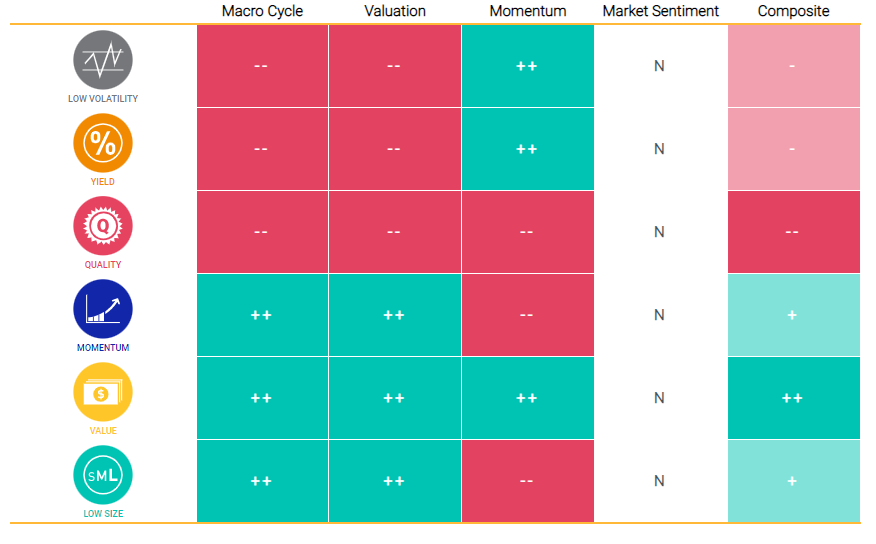
- MSCI’s adaptive multifactor model pointed to an overweight in value, momentum and low size, as of March 31, 2022.
Russia’s invasion of Ukraine in the first quarter of 2022 was met with a major slump in global equity markets, a dramatic increase in the price of West Texas Intermediate crude oil — from USD 75.2 to USD 100.3 — and a rapid rise in the Cboe Volatility Index (VIX), from 17.2 on Dec. 31, 2021, to a peak of 36.4 as of March 7, 2022. The war added uncertainty to a world already recoiling from a surge in inflation and increased risks to economic growth. In this blog post, we view the historical effects of conflict on factor indexes to put the current crisis in context.
But first, a roundup of financial-market and factor performance over the first quarter of 2022.
Rotation from high-risk momentum growth stocks to value stocks
During 2020, at the height of the global pandemic, when there was surplus liquidity from global central banks, investors chased high-risk growth stocks. This trend started to reverse over 2021 (Factors in Focus: Where’s the Value in Defensive Positioning?) — due, in part, to the reopening of economies, high inflation and prospect of rising rates.
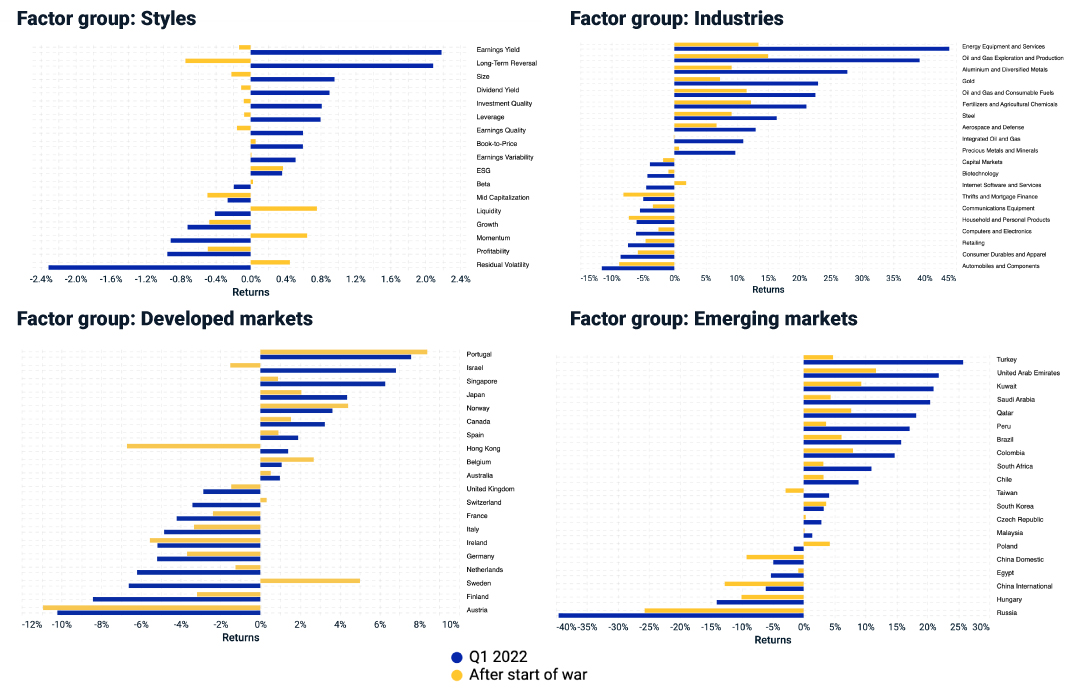
The exhibit below shows the pure-factor performance of MSCI’s Global Equity Model over the first quarter. The MSCI Factor Crowding Model showed that residual volatility and beta remained crowded, while momentum and earnings yield were the least crowded, as of the end of February.
Most of the factor returns came before the start of the war on Feb. 24, and most went down after that date. Within industry groups, those related to oil rallied alongside others that are metal-related. In terms of country factors, a number of countries that were net exporters of oil such as Norway, Canada and some in the middle east outperformed.
Pure-factor performance in Q1 for style, industry-group and country factors

Performance of the MSCI Global Equity Model (GEM+ESG) pure factors from Dec. 31, 2021, to March 31, 2022. Only the top- and bottom-10 factors from industries and countries are shown.
A quarter marked by negative returns
After reaching an all-time high on Nov. 16, 2021, global equity markets posted negative returns in Q1 2022, with the MSCI ACWI Index down 5.3% over the latest quarter. Value, which was overweight in the MSCI Adaptive Multifactor Allocation Model as the quarter began, and yield, which was neutral relative to an equal-weight factor mix, had the highest active returns, driven by rising rates, central-bank tapering and higher inflation. Low volatility also delivered positive active returns in a number of regions, particularly emerging markets, while quality and momentum suffered across the board. In our previous blog post we highlighted the stretch in valuations of quality relative to low volatility. The sell-off in high-valuation stocks may have had a negative effect on quality, despite its defensive characteristics. For example, profitability had a crowding score of 0.9 at the end of November, after being 0.51 at the end of February.
Yield, value and low-volatility stocks outperformed
The table shows regional variations of the MSCI Minimum Volatility Index, MSCI High Dividend Yield Index, MSCI Quality Index, MSCI Momentum Index, MSCI Enhanced Value Index, MSCI Equal Weighted Index and MSCI Growth Target Index, from Dec. 31, 2021, to March 31, 2022. The bar chart shows the active returns of the same indexes, by region, for each month in the quarter, as well as for the full quarter.
Factor performance has varied in wartime
The increase in market volatility and uncertainty surrounding the Russia-Ukraine war raises questions as investors seek to build resilient portfolios.
To help investors put the current crisis in a historical context, we look at the performance of factor indexes during wars — the Afghanistan war, Iraq war, annexation of Crimea and ongoing war in Ukraine. The exhibits below show the relative performance of factor indexes, from one month (~20 business days) before the start of each war to six months (~120 business days) after.
Factor performance differed in different wars
The plots show the performance of MSCI World Factor Indexes, namely, the MSCI Minimum Volatility Index (USD), MSCI High Dividend Yield Index, MSCI Quality Index, MSCI Momentum Index, MSCI Enhanced Value Index and MSCI Equal Weighted Index with respect to MSCI World Index. Start (anchor) dates for each of the wars are as follows: Oct. 7, 2001, for Afghanistan war, March 20, 2003, for Iraq war, Feb. 20, 2014, for Annexation of Crimea and Feb. 24, 2022, for Ukraine war.
What’s clearly evident from the exhibit above is that each conflict presented a unique picture of market and factor performance. Would a minimum-volatility approach have helped during previous times of war? To answer this question, the exhibit below shows the comparison of the volatility of the MSCI World and MSCI World Minimum Volatility (USD) Indexes during the six months after each war began. The MSCI World Minimum Volatility Index had lower volatility in each case.
MSCI World Minimum Volatility Index had lower levels of volatility vs. its market-cap benchmark
The plot shows the annualized volatility of daily returns for MSCI World and MSCI World Minimum Volatility Index (USD) for 120 days (~6months) after the start of the respective wars. Start (anchor) dates for each of the war are as follows: Oct. 7, 2001, for Afghanistan war, March 20, 2003, for Iraq war, Feb. 20, 2014, for Annexation of Crimea and Feb. 24, 2022, for Ukraine war.
MSCI’s adaptive multifactor allocation model
Our adaptive multifactor framework is a model designed to analyze decisions about tilting toward factors. Our research has shown that factors were sensitive to changing market conditions and suggests there has been value in taking a holistic approach to factor assessment that encompasses not only the macroeconomic environment as shown above, but factor valuations, recent performance trends and risk sentiment.
As of March 31, our adaptive multifactor model showed the following exposures across the four pillars:
- The macro-cycle pillar indicated an overweight to value, low size and momentum, based on signals from the Chicago Fed National Activity Index, Federal Reserve Bank of Philadelphia’s ADS Index and PMI.
- The valuation pillar overweighted low size, value and momentum based on the valuation gap compared to an equal-weighted factor mix in the context of nearly 30 years of a factor’s history.
- The momentum pillar selected value, yield and low volatility, based on the last three months’ relative performance.
- The market-sentiment pillar showed a risk-on environment, based on the VIX term structure and a risk-off environment based on credit spreads — resulting in neutral weights for all factors.
Exposures from MSCI’s adaptive multifactor allocation model

As of March 31, 2022. Positive exposures are denoted as + or ++, negative as - or -- and neutral as N.
At the end of Q1 2022, overall, our adaptive multifactor model showed an overweight to value, momentum and low size and an underweight to quality, yield and low volatility, relative to an equally weighted factor mix. While quality was underweight overall, in the long-term quality has played an important role in building resilient portfolios (see Quality in Times of Crisis). The war remains a wildcard, but MSCI will continue to monitor changes to the macro environment and its impact on factor performance throughout 2022.
Further Reading
Which Factors Rose with the Price of Oil?
Factors in Focus: Are Your Equity Styles Ahead of the Curve?
