- We use transaction and order-book data from a leading secondary venture-capital (VC) market platform to assess the valuation dynamics of private growth companies.
- Since January 2020, private-company prices in secondary-market transactions have diverged from the nearest primary financing by a premium/discount of up to 50%.
- We also found that fund marks by active VC fund managers diverged from the prices at which investors are willing to transact on the secondary market by up to 20%.
What can we learn from the relationship between the traded prices of venture-capital (VC) growth stocks in secondary private markets and the valuations highlighted by corporate transactions? Last December, we looked at the characteristics of private-market growth investing using secondary-market trade and order-flow data.1 In this blog post, we investigate the relationship between private-company valuations reported by VC fund managers, the companies’ latest primary financings and the corresponding secondary-market prices. We also examine trends in the premiums or discounts to secondary-market pricing.
Comparing primary-financing and secondary-market levels
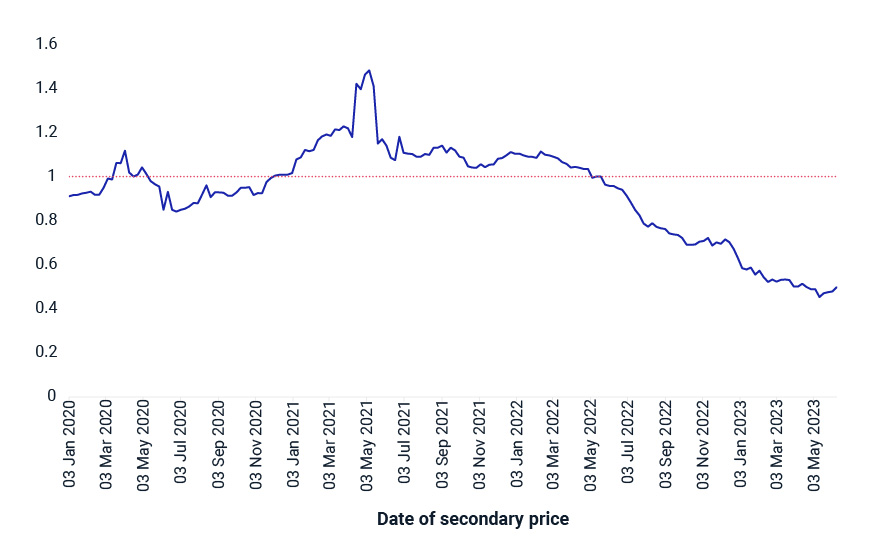
Prices in the secondary private market are anchored on any recent primary financings. But because those financings are sporadic, prices tend to adjust over time to new corporate information as well as changing market and macro conditions. We studied the ratio between the secondary price2 and the latest primary financing level3 over the period from January 2020 to June 2023 using data sourced from ZXData.4 A ratio higher than 1 indicates a market premium relative to primary financing.
From December 2020 to April 2022, most companies traded at a premium relative to their latest primary financing. This period coincided with the best performance of our simulated VC indexes in the earlier blog post. The premium peaked in May 2021, earlier than the VC index peak and aligned with the sell-off in publicly listed growth stocks. The week of May 7, 2021, half of the companies traded at a premium higher than 48%, while the top 25% traded at almost double their primary-financing reference. By June 9, 2023, as macroeconomic concerns grew, the median ratio had dropped to a discount of 50%.
The secondary-VC-market price relative to primary-financing level

Premium calculated as the median over the universe of the secondary price to primary financing ratio. Source: Zanbato. December 2020 to June 2023.
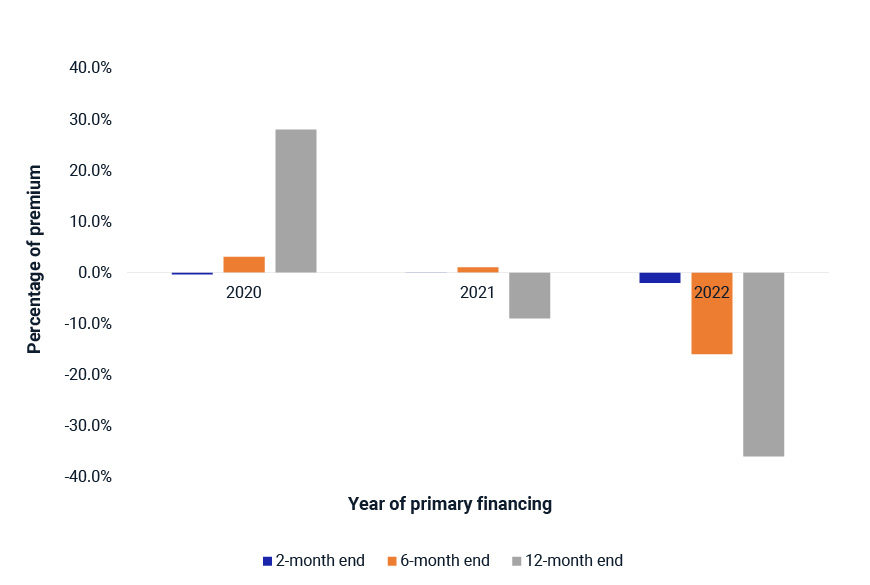
We also grouped companies by the year of their latest primary financing and analyzed their secondary prices at two, six and 12 months after the financing date. Two months after the financing, the prices in the secondary and private markets were similar, regardless of the year.5 This illustrates how the financing level was an important initial anchor. After six and 12 months, however, secondary-market pricing had diverged from those levels. When companies were grouped by quarter instead of year, we reached similar conclusions.
Secondary-market transactions initially anchored to primary financing level but later diverged

Source: Zanbato. January 2020 to June 2023. Bars indicate median of the percentage premium or discount based on trades two, six and 12 months after the financing, grouped by year.
Comparing fund marks and secondary-market transactions
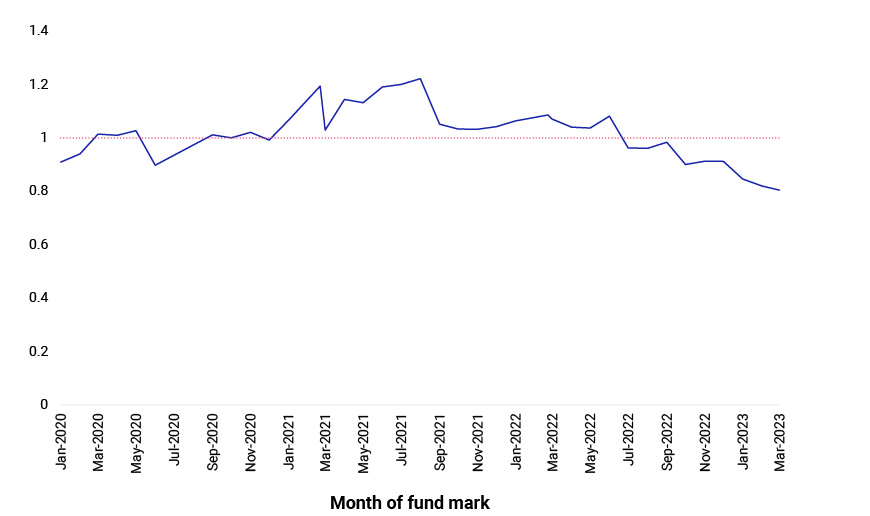
VC funds with regular but infrequent valuations naturally have smoothed net asset values. During a period of market stress, managers tend to avoid prematurely writing down assets they believe still have fundamental value. Consequently, calculated fund volatility and public-market correlation will fall. Using ZXData, we calculated the ratio of secondary price and company fund mark (the valuation estimated by the relevant VC fund) at month-end.6 We examined the distribution of the ratios and their evolution over time.
Fund marks appear to reflect smoothing and delayed price adjustment

Premium calculated as the median over the universe of the secondary-market price to fund mark. Source: Zanbato. January 2020 to March 2023.
From January 2021 to June 2022, most companies traded at a premium relative to the reported fund marks. From the peak in August 2021 when half of the companies had a price premium greater than 20%, a weakening economic outlook saw half the companies slip to a greater than 20% discount relative to their reported fund mark by the end of March 2023. A secondary-market transaction is a concrete assessment of a company’s value by an investor. Therefore, the data suggests that the reported fund marks did reflect material smoothing and delayed adjustment.
Valuation dynamics revealed by traded prices
Valuations proposed for VC growth companies often attract heated debate across the institutional investor community. Our analysis showed that the secondary-market price is initially aligned with the primary-financing level, but then diverges to reflect the latest industry information and evolving economic conditions. We also quantified the extent to which fund marks may not reflect the price at which investors are willing to trade private-company stakes on the secondary market. The use of secondary-market data can thus give fresh insight into the valuation dynamics of private companies often held out as benchmarks for publicly listed growth stocks.
The authors would like to thank Zanbato for permission to use ZXData and Akrati Johari for the detailed discussions that facilitated the preparation of this blog post. Akrati Johari is Chief Growth Officer and Head of ZXData at Zanbato, a leading platform for banks, brokers and their wealth management groups to trade private stock for institutional and private wealth clients.
1The data for both blog posts has been derived from ZXData, the leading market data provider for private companies owned by Zanbato.
2The ZX weekly time-averaged price estimate depends on both transaction prices and prevailing bid/ask orders and is a better indication of current conditions given the 30--45-day lag to complete private transactions.
3Of the 401 companies with primary financing data, we used the subset of 295 with weekly secondary prices from January 2020 to June 2023. We also filtered for a ZXData three-month average Robustness Score of 3 or higher.
4As of June 28, 2023, Zanbato had 1,600+ (mostly VC) companies on its platform and has had ticket volume of USD 145 billion since inception in 2017.
5Given the averaging in the ZX price, a two-month lag is considered a more representative timestamp to evaluate the relevance of the primary-financing level.
6Zanbato collects raw (typically quarterly) fund marks from fund managers and clients and derives monthly dollar-weighted average fund marks. We used the 220 companies with both fund marks and secondary prices (last week of month) as well as a ZXData robustness Score.
Further Reading
Growth Investing in Private Markets: Trends and Transparency
