
- Private-equity investment is often beset by competing claims as to whether the quoted returns are comparable to those in public equity markets.
- Existing return metrics are often based on infrequent asset-based valuations that may disguise current investor appetite to purchase such assets.
- We use transaction and order-book data from a leading secondary venture-capital market exchange for more timely insights into venture capital trends and relate them to public markets.
Private Equity: Institutional Flows and the Debate on Returns
As asset owners seek to hit target returns driven by asset-liability studies,1 private-equity (PE) investment has gained in importance for institutional investors. U.S. and U.K. retail investors have also seen their access eased.2 This trend has been amplified in the technology sector, as private-markets funds have allowed companies to grow globally without the traditional exit by initial public offering (IPO) or acquisition. Investment themes from future mobility to the digital economy have ecosystems where the major players now straddle the line between private and public markets. Major asset owners, with their long-term horizons, may also consider “total equity” allocations, irrespective of their venue or liquidity.
However, this move to PE investing has not been without its challenges. The post-listing performance of the swathe of SPAC listings3 (which sidestepped full IPO scrutiny) and the popping of the “growth bubble” in mid-late 2021 brought into question some of the prior valuations used to calculate PE returns. Traditional metrics for private markets like internal rate of return have been heavily criticized by some as being open to distortion, as have the level and transparency of associated fees.4 In this blog post, we take a different approach and leverage secondary transactions and order flow data5 to help gain clearer insights, at a much higher frequency, into the investor appetite for such privately-held companies, thus combining “insider” views (employee divestments) with reallocations by institutions or ultra-high net worth managers. We seek to gauge the characteristics of this marketplace and thus assess how an index of such companies lines up relative to natural public-market peers.
Measuring secondary private-market liquidity and activity
The addressable market for high growth venture capital (VC) investing has been estimated at approximately 1,400 companies that have raised USD 426 billion and are valued at nearly USD 5 trillion.6 We have focused on an eligible universe of around 200 of the most active, secondary-growth private companies on the Zanbato platform (their higher trading data quality or “robustness score” closely aligns with the largest valuations and fundamental size).
This company-level score ranges from one to 10 and is based on the average number of closed trades, the number of buy and sell orders, and how little skew exists in the order book.7 A higher score indicates a more reliable price signal8 with greater market depth. We see below that the proportion of companies with scores of at least three grew from 6% to around 50%, with a rollover echoing that of public market growth companies with an approximate six-month delay. These are companies with an order book but potentially no recent closed trade. In contrast, the proportion with a score of at least six (a deep order book and recent execution) has been more stable. Volume growth has mirrored the order book growth trend with variation due to seasonality and sentiment.
Trading activity distribution: Robustness score proportions
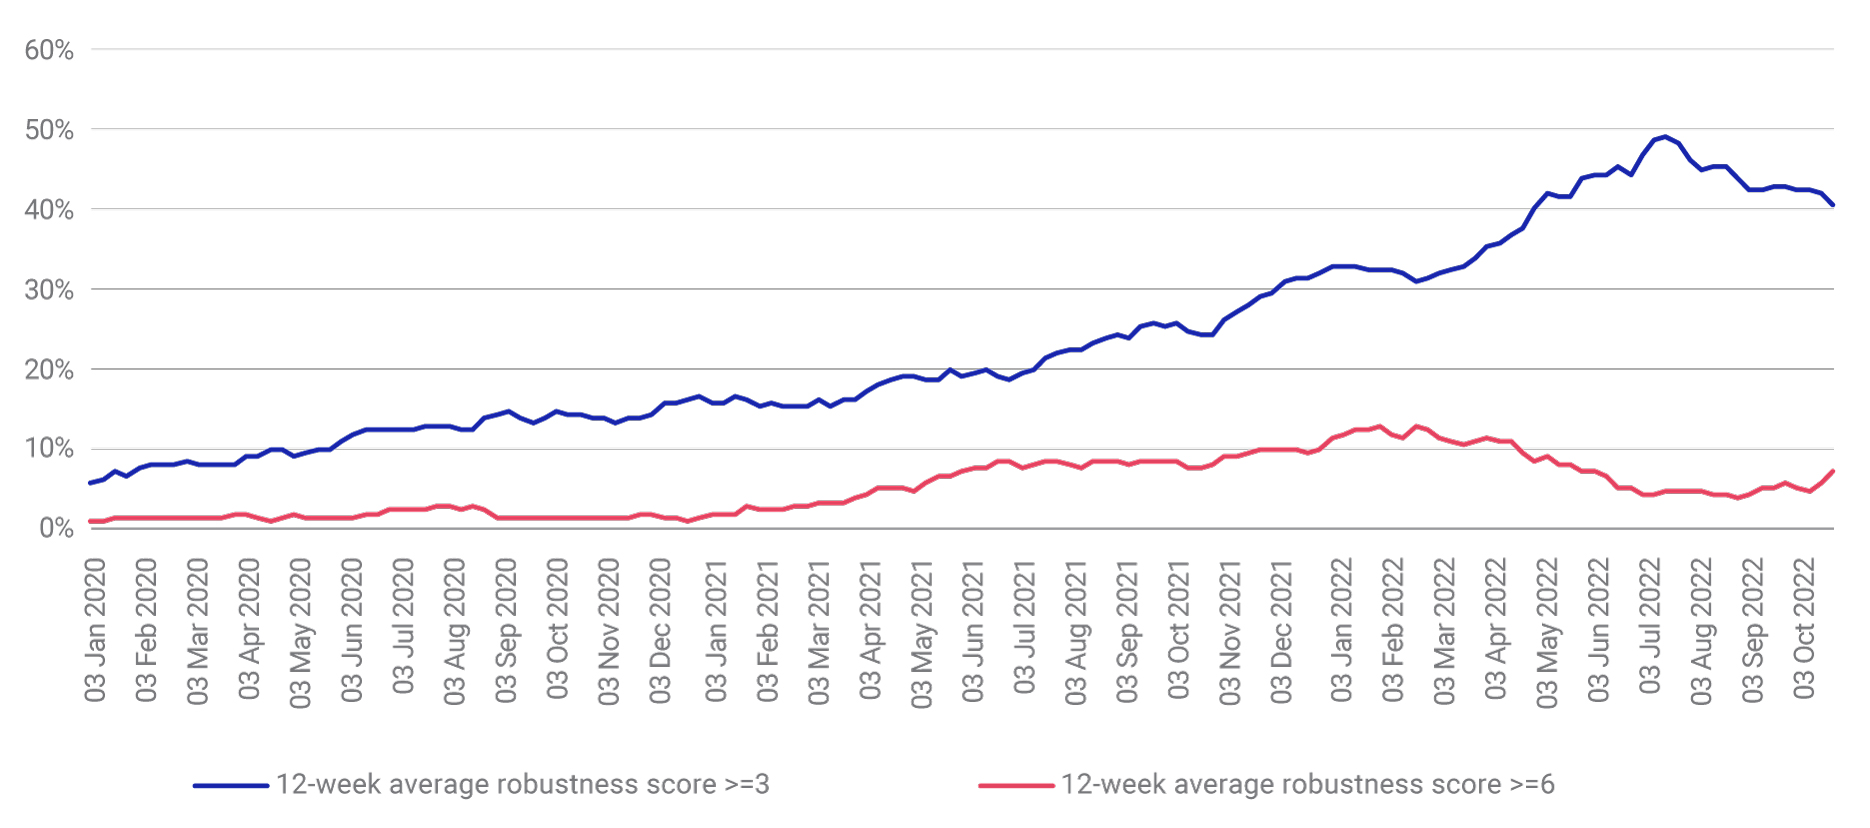
Source: Zanbato, December 2020 to October 2022.
Below, we show the technology tilt in the eligible universe (84% of the companies are U.S.-based).
Eligible universe industry distribution
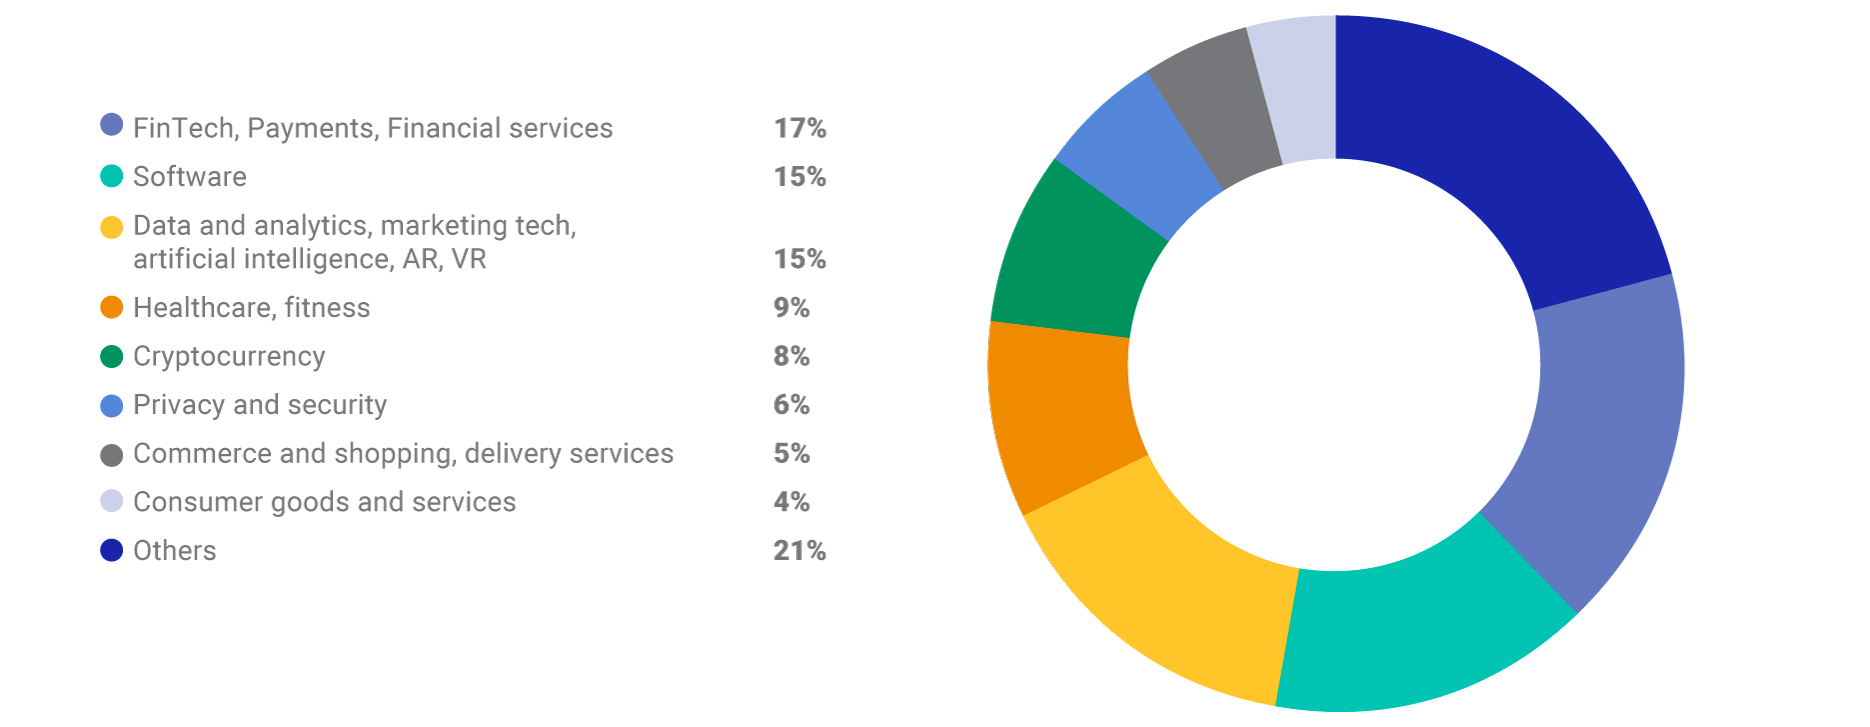
Multi-industry assignment based on ZX, the Zanbato trading platform. Data as of Oct. 21, 2022.
An index for private market growth investing
To help understand the characteristics of this market and compare it with public equity, we filtered our universe to build a potential indicator of private markets growth investing.9 Companies with a 12-week average robustness score of at least 3 and order volume10 above USD 5 million were chosen (see below).11 Note the three- to six-month month lag to the growth market rollover.
Leading venture capital growth index simulation
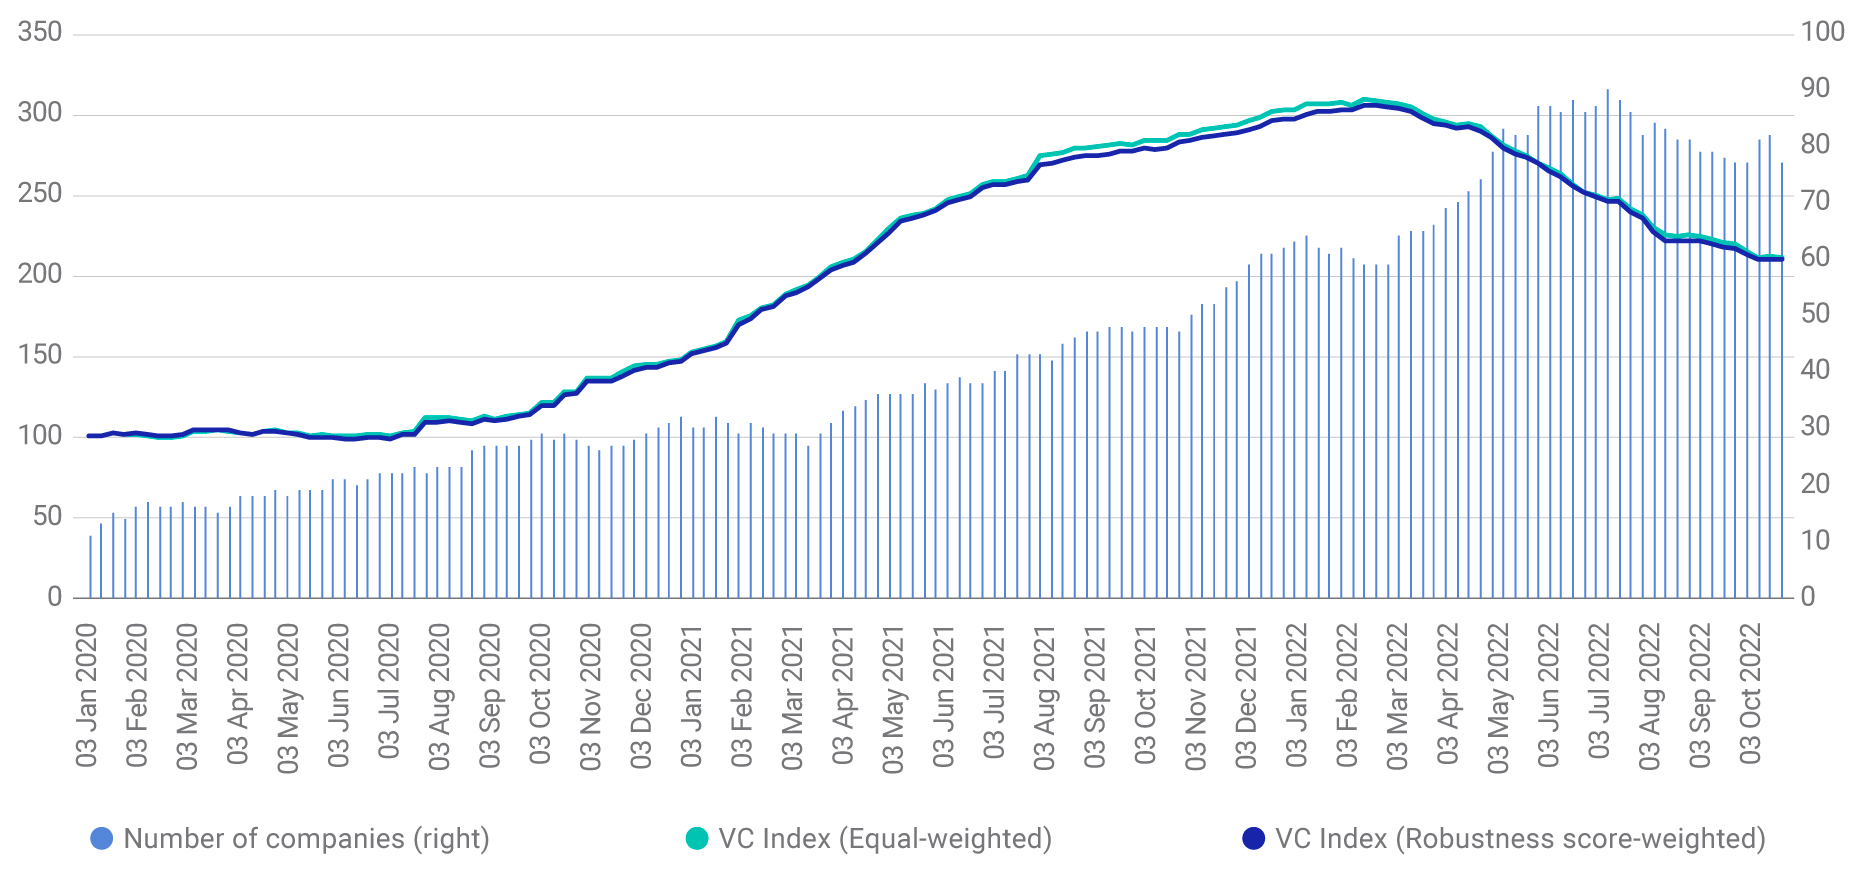
Source: Zanbato. January 2020 to October 2022.
Given the industry mix shown earlier, we compare the performance of the index simulation below with public market comparators. For reference, the simulation outperformed the MSCI ACWI Fintech Innovation, US Tech 125 and USA Small Cap indexes over the study period. There was also less volatility, although there is smoothing inherent to ZXData and there was no initial pandemic whipsaw effect.
Index risk and return: Robustness score weighted index vs. public market peers
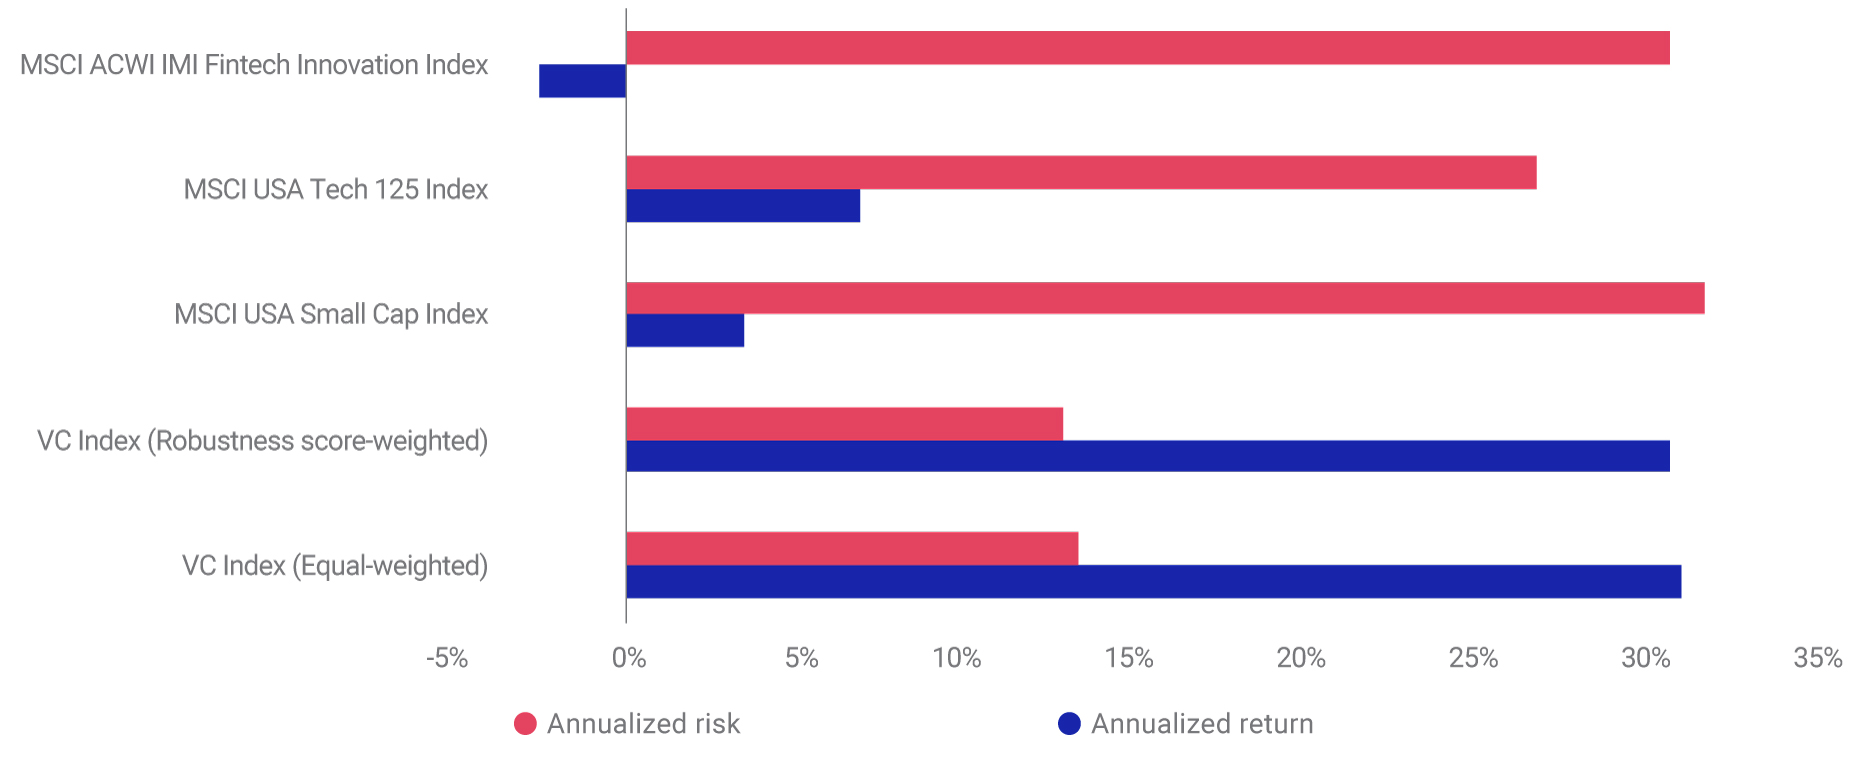
Source: Zanbato. January 2020 to October 2022.
The chart below contains the 15 largest constituents of the score-weighted index. All but two are U.S.-based with fintech names having the highest index weight. The representation of industries over time is consistent with the earlier snapshot.
Top constituents in robustness score-weighted index simulation
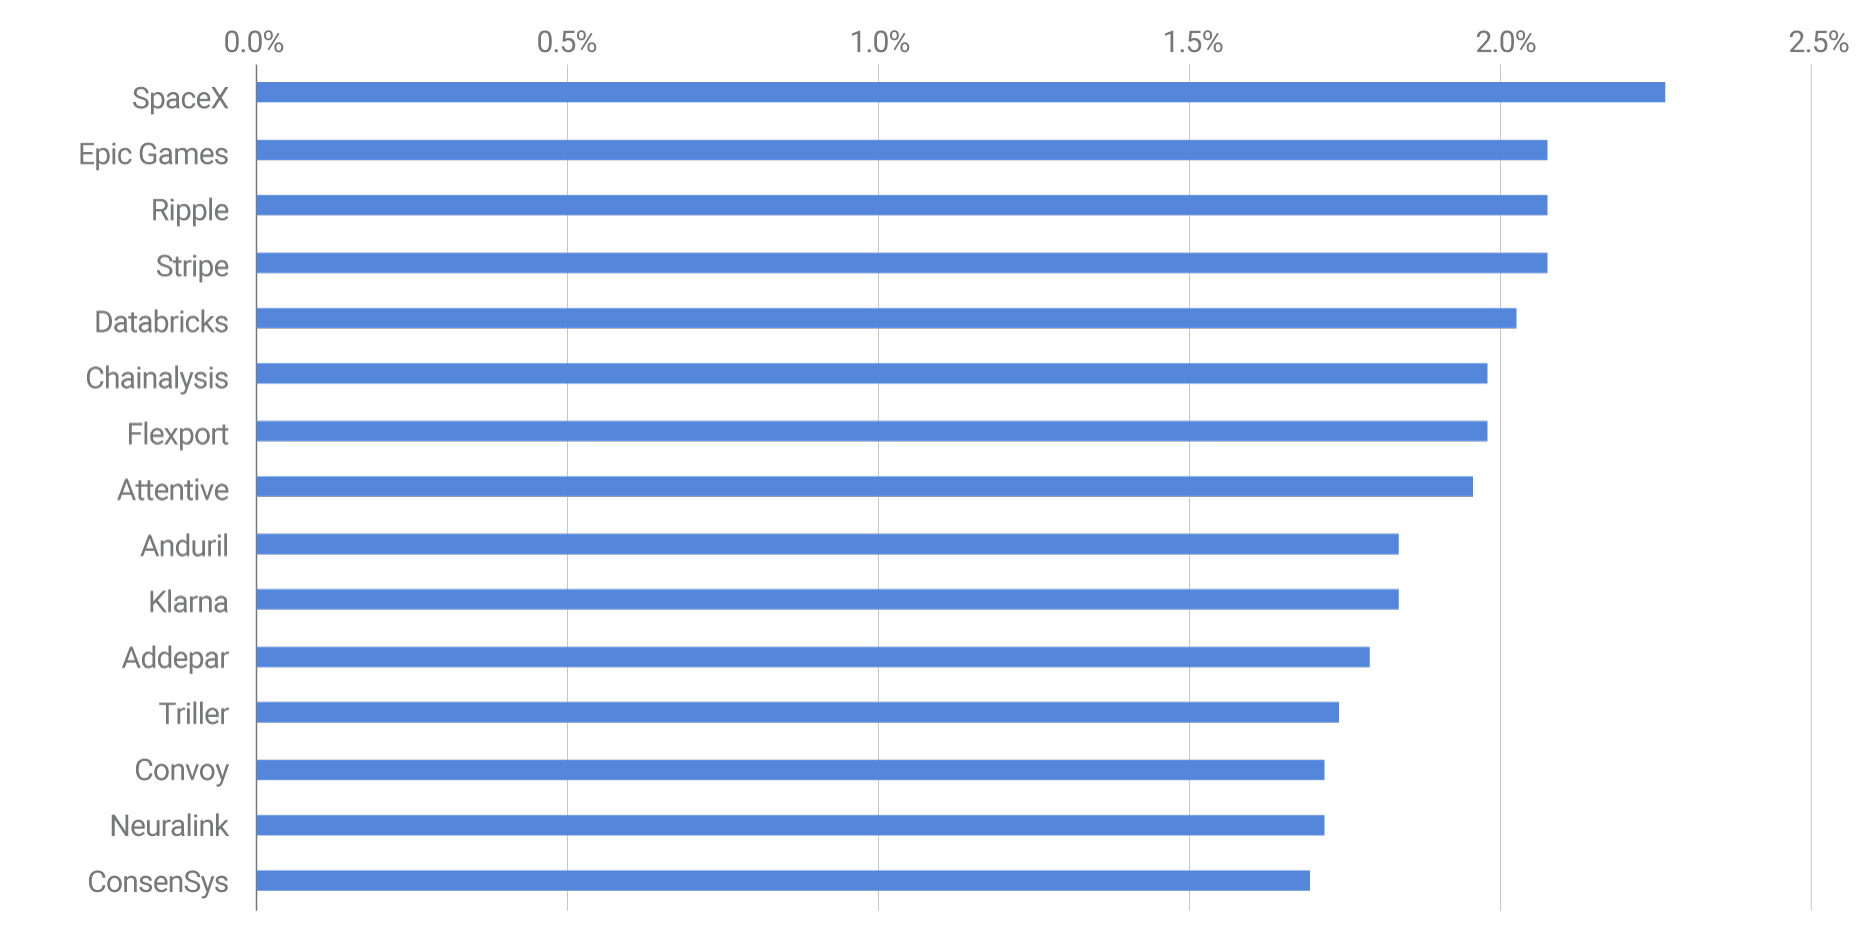
Source: Zanbato, Data as of Oct. 21, 2022.
Looking toward “total” growth investing
VC company performance is challenging to analyze. Our observation of a three- to six-month lag relative to public markets could potentially reflect the time for pricing expectations to adjust to economic trends that may be reflected more immediately in public markets. To help bridge the analysis gap, we illustrated how the developing secondary market for high growth private companies can be leveraged to help assess this market with relatively high frequency compared with traditional metrics, which could allow investors to make more informed decisions.
The authors would like to thank Zanbato for permission to use ZXData and Akrati Johari for the detailed discussions that facilitated the preparation of this blog post. Akrati Johari is Chief Growth Officer and Head of ZXData at Zanbato, a leading platform for banks, brokers and their wealth management groups to trade private stock for institutional and private wealth clients.
1 Willis Towers Watson, “Institutional Allocation to Private Equity: A Maturing Industry Calls for a Differentiated Approach,” May 5, 2021. bfinance, “Global Asset Owner Survey: Traps and Transitions,” November 2022.
2 Godbout, Ted, American Society of Pension Professionals & Actuaries, “DOL Clarifies Guidance on Private Equity in 401(k) Plans,” Dec. 22, 2021. PWC, “UK pensions funds and private equity: time to talk?” Dec. 8, 2021.
3 Special Purpose Acquisition Company
4 Phalippou, Ludovic, University of Oxford, “An inconvenient fact: private equity returns and the billionaire factory,” June 15, 2020. Ennis, Richard M, “How to Improve Institutional Fund Performance,” Mar. 31, 2021. Lerner, Josh, Mao, Jason, Schoar, Antoinette, Zhang, Nan R., Harvard Business School, “Investing Outside the Box: Evidence from Alternative Vehicles in Private Equity”, May 7, 2020. MacArthur, Hugh, Lerner, Josh, Bain & Company, “Public vs. Private Equity Returns: Is PE Losing its Advantage?” Feb. 24, 2020.
5 Derived from ZXData, a leading market data provider for private companies owned by Zanbato. Zanbato has 1,300+ (mostly VC) companies on its platform and has seen ticket volume of USD 115 billion since inception in 2017.
6 Estimate based on the Crunchbase Unicorn Board. As of Dec. 1, 2022.
7 Order book skew measures the imbalance between buy and sell orders. Companies that have more asymmetric order books skewed to one side or the other will have lower robustness scores.
8 The ZX weekly time-averaged price estimate depends on both transaction prices as well as prevailing bid/ask orders. This is a better indication of current conditions given the 30–45-day lag to complete private transactions.
9 Such an index could be used as a (component of a) benchmark, as a marker of growth investing sentiment or the basis of financial products.
10 Three-month aggregate volume.
11 The source data for the 200-plus active companies is for five years. We analyzed it from the start of 2020 from when at least 30 of these companies were on the platform.
Further Reading
New Frontiers in Carbon Footprinting: Private-Equity and -Debt Funds
Can Private Assets Withstand So Much Public Attention?
What Drove Private-Credit Funds’ Outperformance?
