- Plotting the most efficient course to net-zero carbon emissions in real estate may not be as straightforward as one might think.
- Analysis of a hypothetical portfolio illustrates the importance of energy and emission intensity, asset value and physical size as important determinants of asset- and portfolio-level climate-transition risk.
- The most energy-intensive assets are not necessarily the most emission-intensive, and the most emission-intensive assets do not necessarily register the highest MSCI Climate Value-at-Risk measure.
Climate risk is increasingly atop real estate investors’ minds — particularly the transition risk associated with a societal shift toward a low-carbon economy. Many investors and asset managers have made bold commitments in regard to transitioning real estate portfolios to net-zero carbon emissions and are now developing and implementing plans to achieve these goals. But what could this transition look like in practice for property portfolios?
Drivers of Climate-Transition Risk
The MSCI (transition) Climate Value-at-Risk (VaR) measure estimates the potential valuation impact from the future expected costs of carbon-emission reduction. This depends on three broad factors that vary by asset: current emissions intensity; target emissions intensity; and asset value, which determines its weight in the portfolio and its pricing on a per-square-meter basis.
Current emissions intensity depends on energy intensity and mix. Energy intensity is driven by usage in relation to the physical size of a building. Some assets use more energy because they are inefficient or poorly insulated, while others have tenants who simply consume more energy.
Countries vary in the cleanness of their energy mix. Some are heavily reliant on fossil fuels, while others have a large proportion of renewable energy or nuclear power. Even within countries, some assets specifically procure, or generate on-site, energy with a cleaner-than-average energy mix.
Current and target carbon-emission intensities drive carbon-reduction requirements and hence expected mitigation costs, but the economic significance of these costs vary, on a relative basis, with an asset’s aggregate and per-square-meter valuation.
Analyzing a Simulated Portfolio
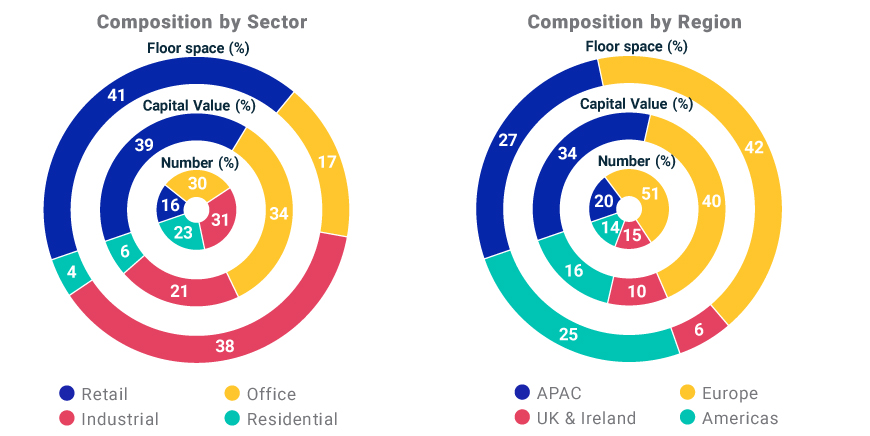
We constructed a simulated portfolio of 100 hypothetical assets using distributions of asset characteristics within the MSCI Global Annual Property Index. The exhibit below describes the portfolio composition by property type and geography measured by number of assets, capital value and floor space.
Simulated Portfolio’s Composition

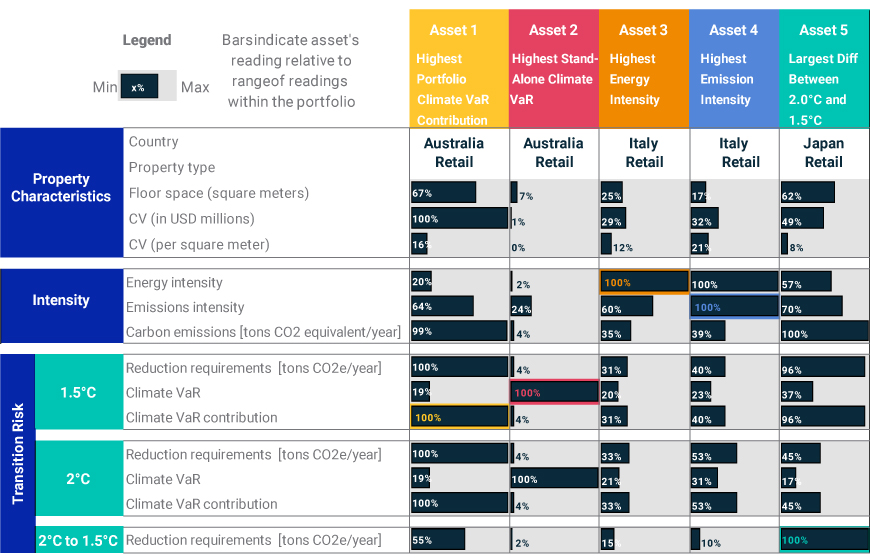
Based on valuations from December 2020, the simulated portfolio has an aggregate Climate VaR of -6.4% under a scenario in which global temperature rise is held to 1.5° Celsius (1.5°C) by the year 2100.The potential valuation impact on the aggregate portfolio masks significant variation of asset-level impacts, which range from 0% to -53% on a stand-alone basis and between 0 to 60 basis points (bps) in terms of portfolio contribution. The table below highlights the impacts of five noteworthy assets within the simulated portfolio to illustrate how portfolio analysis can be translated into mitigation action.
Highest-Risk Assets Are Not the Most Emission-Intensive

Asset 1, an Australian superregional mall, contributed 60 bps to the overall portfolio Climate VaR — just over 10% of the total risk, punching above its weight in terms of capital value (6.5%). Its significant contribution is a function of relatively high emission intensity, but primarily due to its large weight within the portfolio. The most effective solution for this asset might be to explore a cleaner mix of energy. Its large size and hence weight in the portfolio would warrant high priority for action.
Asset 2, a small Australian industrial building, has the highest stand-alone valuation impact (-53%), but an almost negligible contribution to aggregate portfolio risk due to its low capital-value weight. Its energy and emission intensities are not particularly high, but the costs associated with carbon reduction are more financially significant for this asset when compared with its low value per square meter. Even though it has such a large Climate VaR, a manager may deem it a low priority for mitigation efforts due to minimal impact on the portfolio and relatively low emission intensity.
Assets 3 and 4 have the highest energy intensity within the portfolio. Both these assets are retail malls in Italy, a country with relatively energy-inefficient building stock. Despite almost identical energy intensity, Asset 3 has significantly lower emissions intensity due to a less carbon-intensive energy mix, leading to lower Climate VaR. The most cost-effective mitigation actions may vary for these seemingly similar assets.
Asset 5 is a Japanese mall and has almost the same Climate VaR contribution as Asset 1 under a 1.5°C scenario, but significantly less so under a 2°C scenario due to Japan’s relatively unambitious carbon-reduction requirements stemming from its nationally determined contributions under the Paris Agreement. Among assets in the portfolio, this property has the largest difference between its 2.0°C and 1.5°C emission-reduction requirements and hence presents very different risk levels and contributions under these two warming scenarios.
The interactive exhibit below shows asset-level Climate VaRs, carbon-reduction requirements and asset contributions to portfolio-level Climate VaR. Each of these measures can be plotted versus other criteria such as carbon and energy intensity (see the dropdown menu for the full list). Hover over an asset to see how its characteristics compare to the portfolio.
What Drove Climate-Transition Risk Across the Portfolio?
Finding a Portfolio’s Specific Path to Net-Zero
Climate-transition risk may not be equally distributed across real estate portfolios. It might be that the asset at most risk on a stand-alone basis has one of the smallest contributions to portfolio risk. Characteristics such as energy and emission intensity and capital value on an absolute and per-square-meter basis drive such results. Analysis of the type illustrated above could help investors plot their tailored course to net-zero carbon emissions for their own portfolios.
The authors thank Fritz Louw for his contribution to this post.
Further Reading
2021 Real Estate Trends to Watch
Measuring Climate Risk in Real Estate Portfolios
Real Estate’s Climate-Transition Risk: The Path to Net-Zero
How Have Stocks Responded to Changes in Climate Policy?
