Small caps have historically outperformed their larger counterparts in both developed and emerging equity markets, especially after recessions. We found similar results in the China A shares market. China small caps, proxied by the MSCI China A Onshore Small Cap Index, had a 9% active return over midcaps and large caps, represented by the MSCI China A Onshore Index, in the first half of 2023 and outperformed by 3.4% annually over the last approximately 18 years.
China A small caps did, however, have considerably higher annualized volatility than larger stocks, as the following exhibit shows. In comparison to other emerging markets, China’s domestic small caps’ annualized return premium was 1.9% higher. Over the same period, developed-market small caps posted no active return premium.
China small caps’ have outperformed domestic larger caps

China A shares’ developing depth and breadth
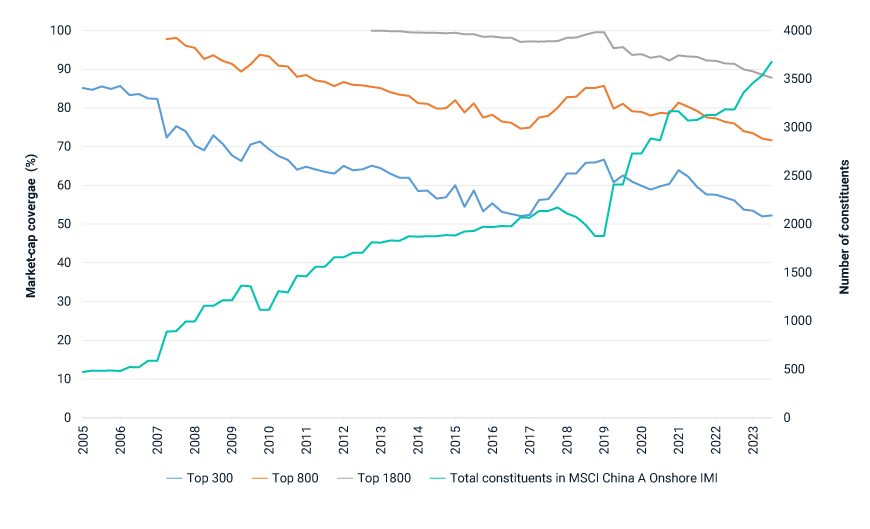
For anyone who may not have been watching, the landscape of the China A shares market has been changing rapidly. As a result of market reform, including the ChiNext board, STAR board[1] and a registration-based IPO system,[2] as well as support for entrepreneurship and innovation,[3] the number of A shares increased to 5,030 as of July 2023 from 1,349 in January 2005. A significant portion of the new listings were small-cap firms, expanding the depth and scope of the segment.
Based on MSCI’s Global Investable Market Index methodology framework, the MSCI China A Onshore Index and MSCI China A Onshore Small Cap Index include securities ranked between 0-85% and 85%-99% market coverage, respectively, based on cumulative free-float-adjusted market capitalization. This segment-target approach allows the number of index constituents to change automatically as the broad, rapidly changing market expands.[4] In contrast, the market coverage of a top-n-stocks approach shrinks as the market expands. The following exhibit illustrates this declining coverage.
China A shares: Shrinking coverage in a fixed-number approach to index construction

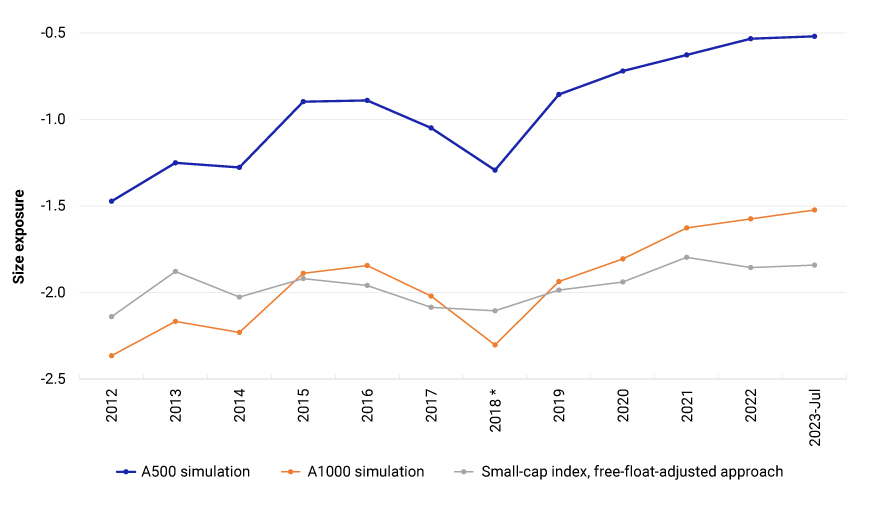
The market-coverage approach has produced a transparent and size-consistent index. Over our analysis period from January 2012 to July 2023, the free-float-adjusted market-cap-coverage approach maintained stable exposure, around -2.0, to the CNLT size factor.[5] In contrast, the simulated indexes with a fixed number of constituents displayed notable size drift. For example, a hypothetical A500 simulation moved closer to a large-cap bias from a midcap bias, and a hypothetical A1000 simulation migrated toward midcaps from small caps.
Free-float-adjusted coverage approach has had stable small-cap exposure

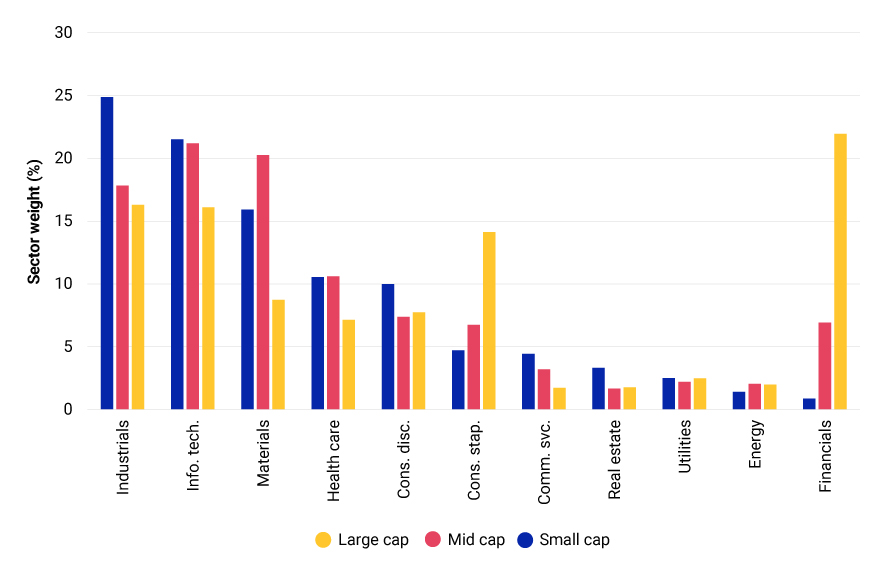
As of July 31, 2023, the Global Industry Classification Standard (GICS®)[6] industrials, information-technology, materials and health-care sectors had a 70% weight in the small-cap segment of the China market. High-tech enterprises, especially smaller ones, have been singled out for stepped-up financial support from the Chinese government.[7] The free-float market-cap-coverage approach also captured a broader swath of companies from niche industries, such as data processing and outsourced services.[8]
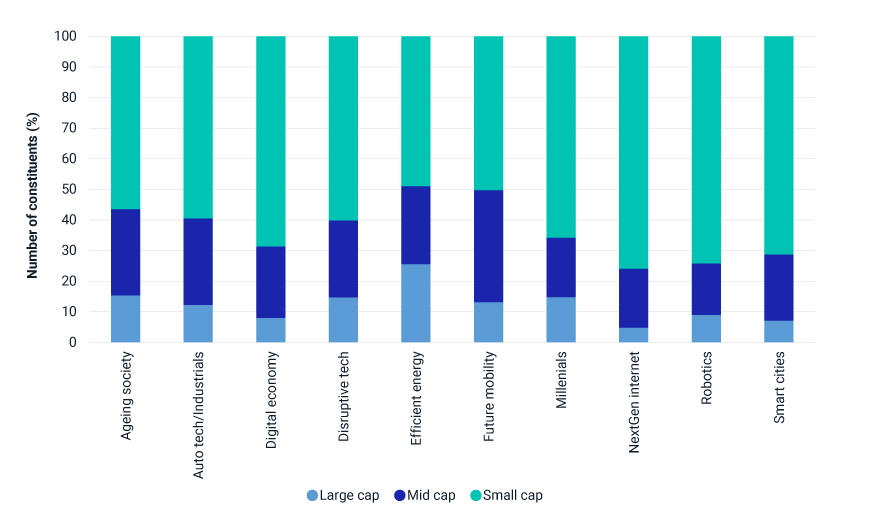
Megatrends, such as robotics, smart cities, nextgen internet, digital economy and disruptive tech, were also strongly represented in the small-cap segment.
Small-cap segment had higher weight in new-economy and technology sectors…

… and themes

The scope and depth of the small-cap segment in China A shares has evolved and expanded quickly in recent years. Compared to larger stocks in the domestic market, the segment had the largest weight in high-tech and innovative industries. The market-cap-coverage approach to index construction provided a more comprehensive and stable small-cap set of constituents than the fixed-number approach, while balancing liquidity and investability characteristics.
The author would like to thank Shuo Xu and Yolanda Wang for their contributions to this blog post.

