
- We found that small-cap firms have historically outperformed larger ones, especially after recessions and over longer holding periods.
- Across both developed and emerging economies, small caps are currently exhibiting strong fundamentals and cheaper valuations compared to their own history.
- Institutional investors may have concerns about small-cap allocations due to past liquidity challenges. Our analysis indicated, however, that the liquidity metrics for small caps have improved.
High inflation, elevated interest rates and heightened geopolitical risks are making many investors nervous about the strength of the global economy. The International Monetary Fund is forecasting a slowing global economy later this year followed by a rebound next year.1 Some investors are already evaluating opportunities offered by a post-slowdown world. One of these opportunities is small-cap stocks, which have historically outperformed large caps, especially after recessions. It is noteworthy that the small-cap indexes have exhibited higher risk (volatility) and higher extreme underperformance (max drawdown) relative to respective standard indexes.
US small-cap-factor outperformance in the 12 months following recessions
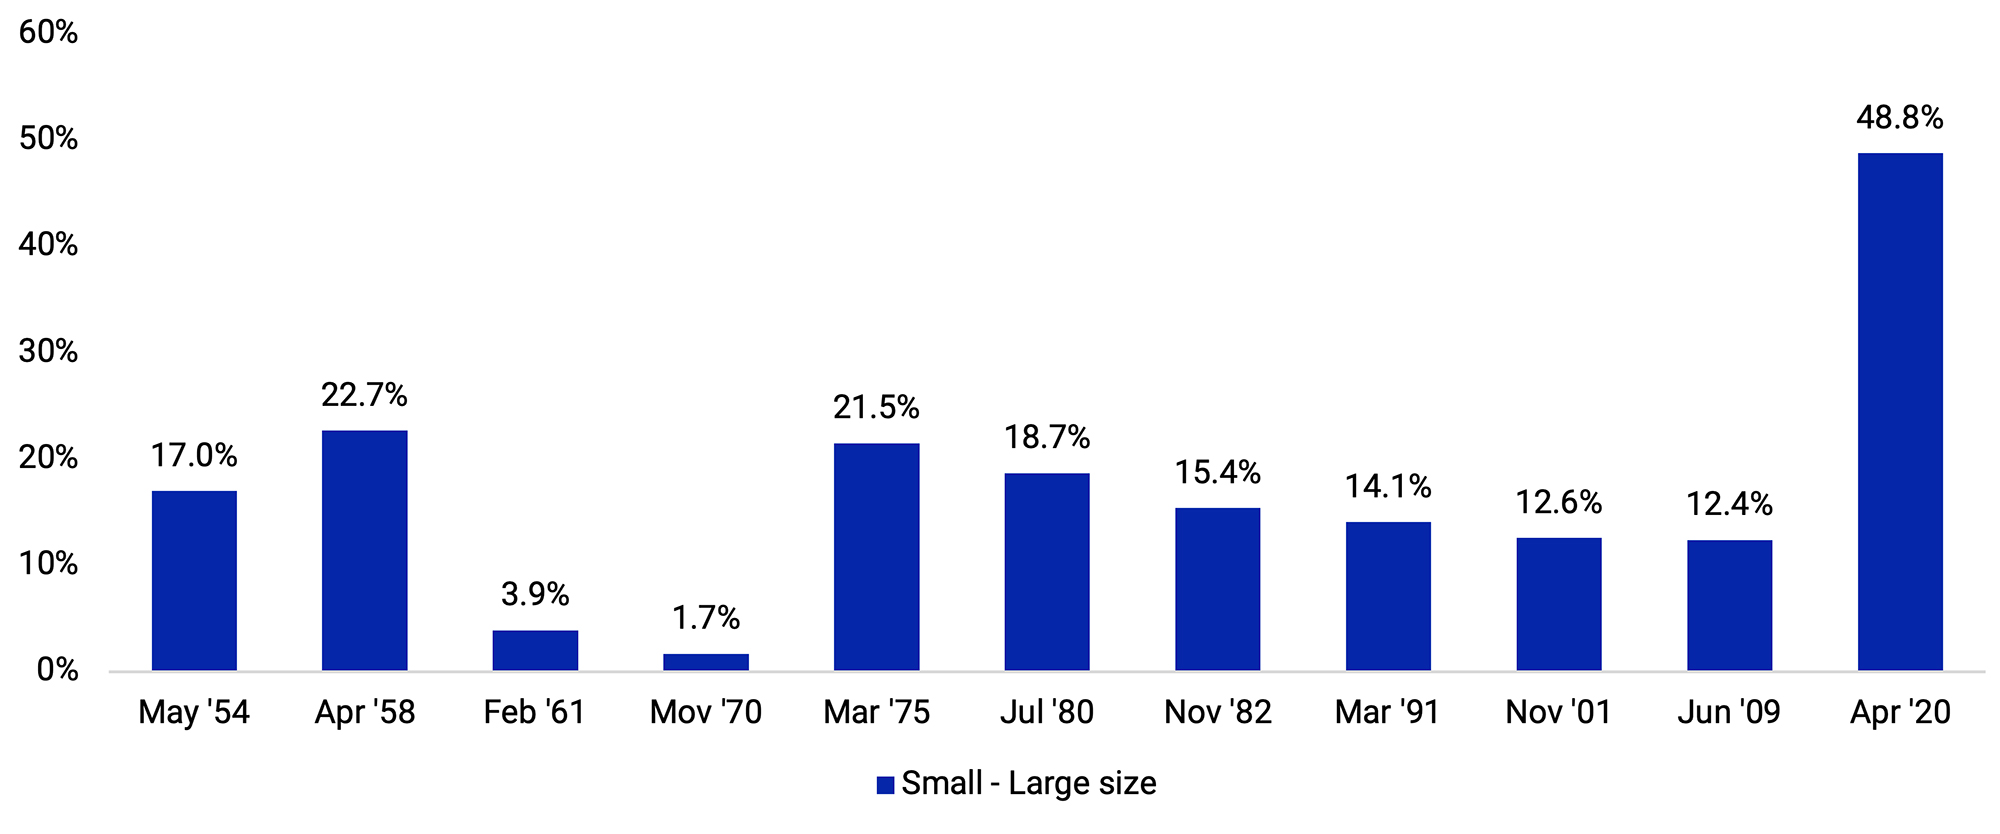
The exhibit shows the active performance of a U.S. small-cap (size-sorted bottom 30%) cap-weighted portfolio over of a U.S. large-cap (size-sorted top 30%) cap-weighted portfolio for the 12-month period following recessions. Source: Kenneth R. French Data Library
Longer lookback period, historically better chance of small-cap outperformance
Since December 1998, small caps have outperformed their larger counterparts in both developed and emerging economies. Over this period, the MSCI World Small Cap Index posted an annualized excess return of 2.69% compared to the MSCI World Index, while the MSCI Emerging Markets Small Cap Index outperformed the MSCI Emerging Markets Index by an annualized 0.54%. Between 2011 and 2020, however, as global equity markets rallied on the back of central banks’ accommodative monetary policies, small caps struggled to keep pace with large caps. The MSCI World Small Cap Index underperformed the MSCI World Index by 0.40% on an annualized basis, while the performance of the MSCI Emerging Markets Small Cap Index fell short of the MSCI Emerging Markets Index’s performance by an annualized 1.4%.
Key metrics of MSCI’s small-cap indexes
The analysis period is December 1998 to June 2023. Metrics are based on monthly gross USD returns.
Given the recent challenges for small caps, we wanted to evaluate their performance relative to larger companies over longer horizons. Using a rolling-window analysis, we found that the frequency of outperformance of smaller companies in both developed and emerging markets steadily improved as the holding period was extended. Historically, over a 15-year investment horizon, small caps have outperformed large caps about 9 in 10 times, as represented by the respective MSCI indexes.
Historical frequency of small-cap outperformance over different investment horizons
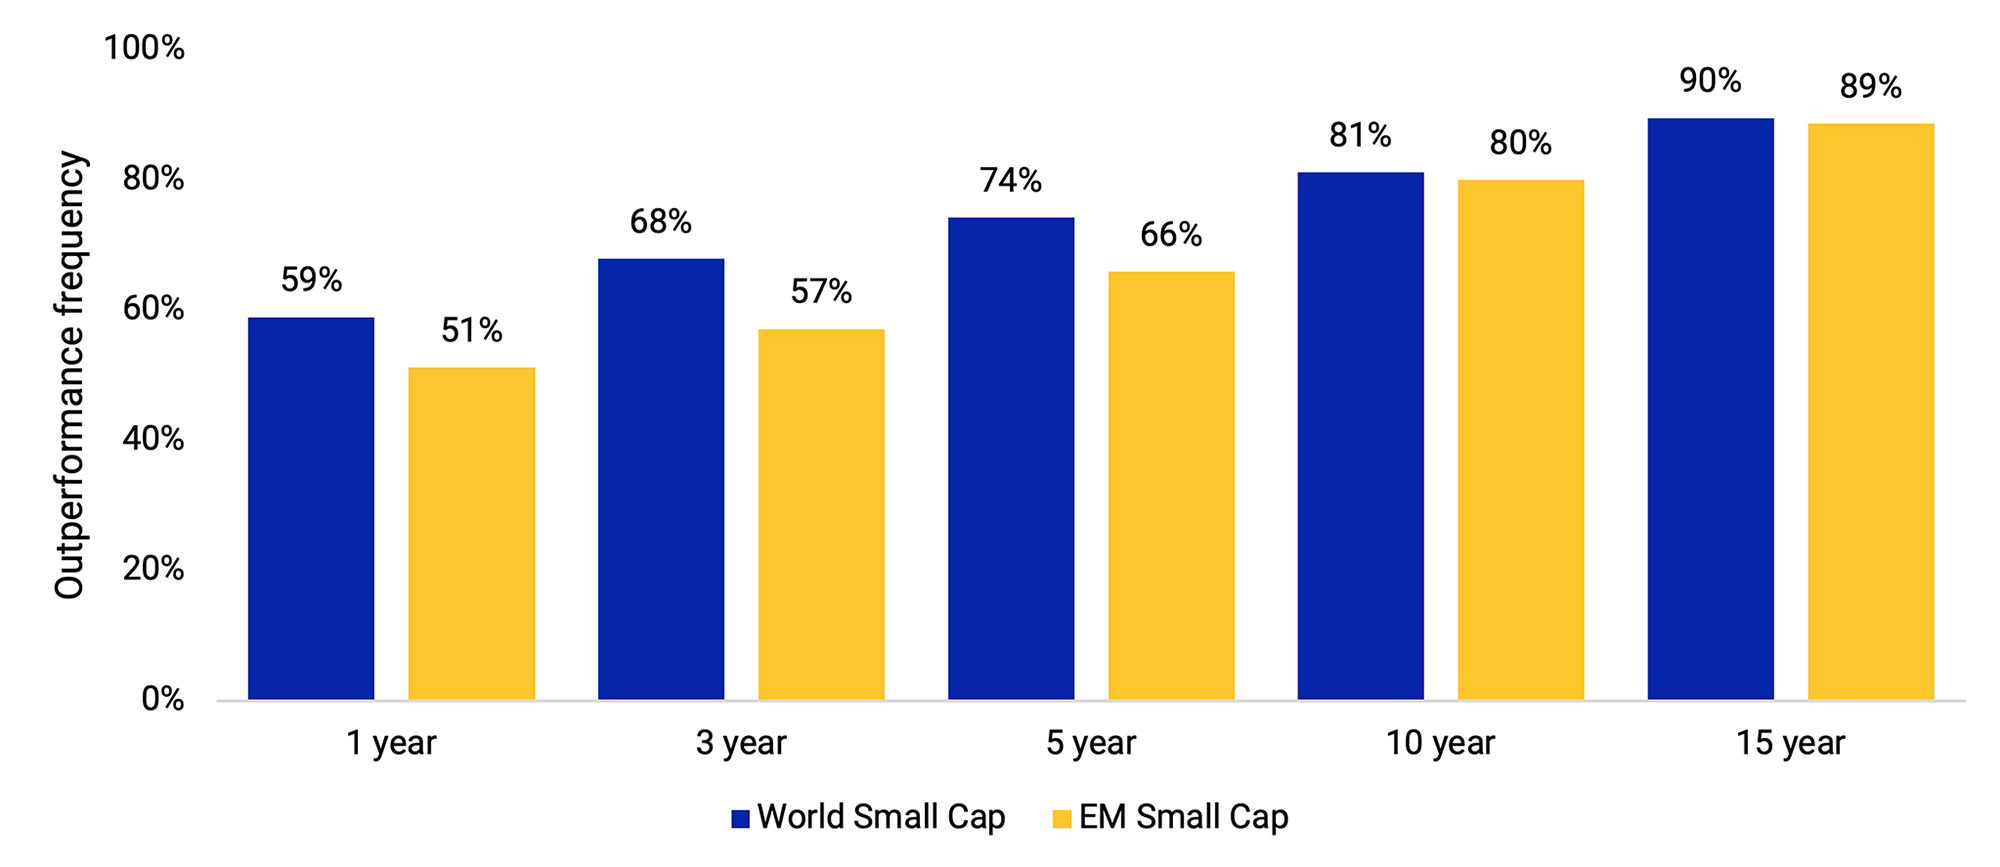
The exhibit shows the percentage of instances when small-cap stocks (represented by the MSCI World Small Cap Index or the MSCI Emerging Markets Small Cap Index) outperformed large-cap stocks (represented by the MSCI World Index or the MSCI Emerging Markets Index, respectively) in a rolling-window analysis. The analysis periods are November 1975 to June 2023 for the world and December 1998 to June 2023 for the emerging-markets region. The track record of the MSCI World Small Cap Index is proxied by the MSCI World Equal Weighted Index prior to December 1998 due to data limitations.
Valuations and fundamentals helpful in assessing relative attractiveness
The historical excess performance of small caps has been supported by the size premium, but valuations and profitability could be useful measures for assessing the relative attractiveness of small caps. We use the 12-month forward price-to-earnings ratio (P/E) of the MSCI World Small Cap Index as a measure of valuation and the index’s return on equity (ROE) as a measure of profitability. As of May 2023, compared to the last 15 years, small caps were trading at a historically cheap valuation while profitability was close to a historical high (yellow dot in the following exhibit).
Compared to the last 15 years, small caps have been historically cheap
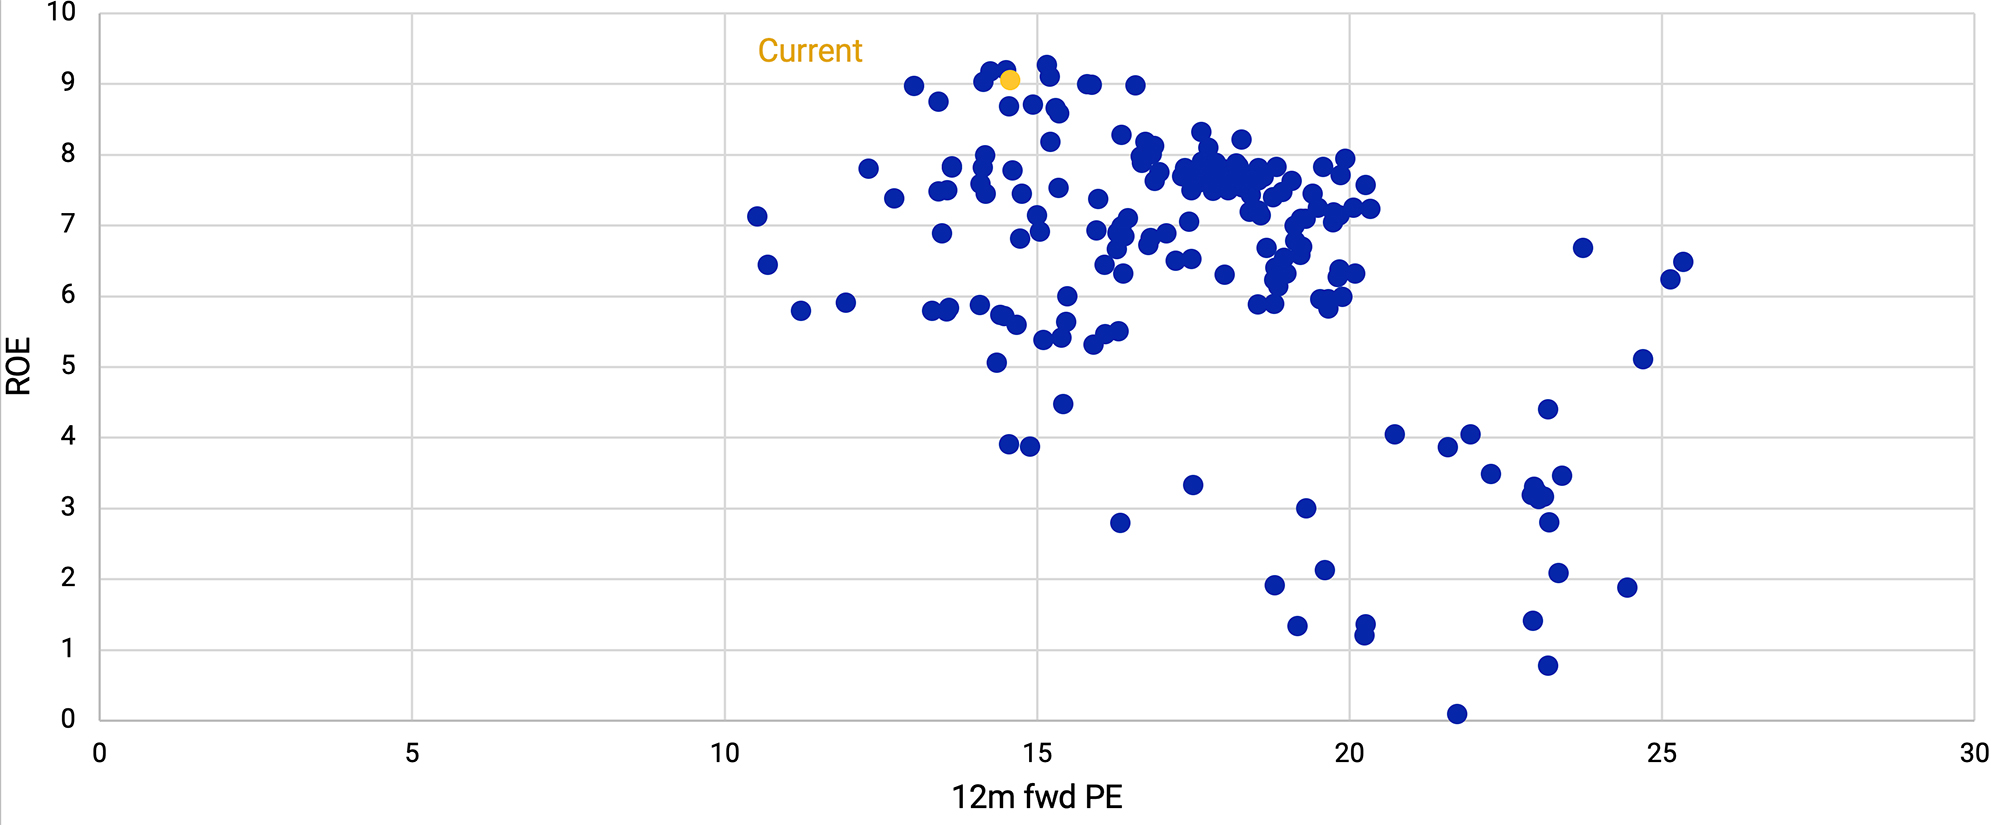
The exhibit plots the 12-month forward P/E and ROE of the MSCI World Small Cap Index each month from June 2008 through May 2023. The yellow dot shows valuation and profitability as of May 2023.
Another important fundamental is earnings. The next exhibit shows that since June 2021 small caps’ historical EPS growth has trended upward (blue line). From the beginning of 2023, analysts’ EPS forecasts for small caps (yellow line) have begun to improve, after being on a steady decline since 2021.
In 2023, both actual and forecast EPS growth have trended up
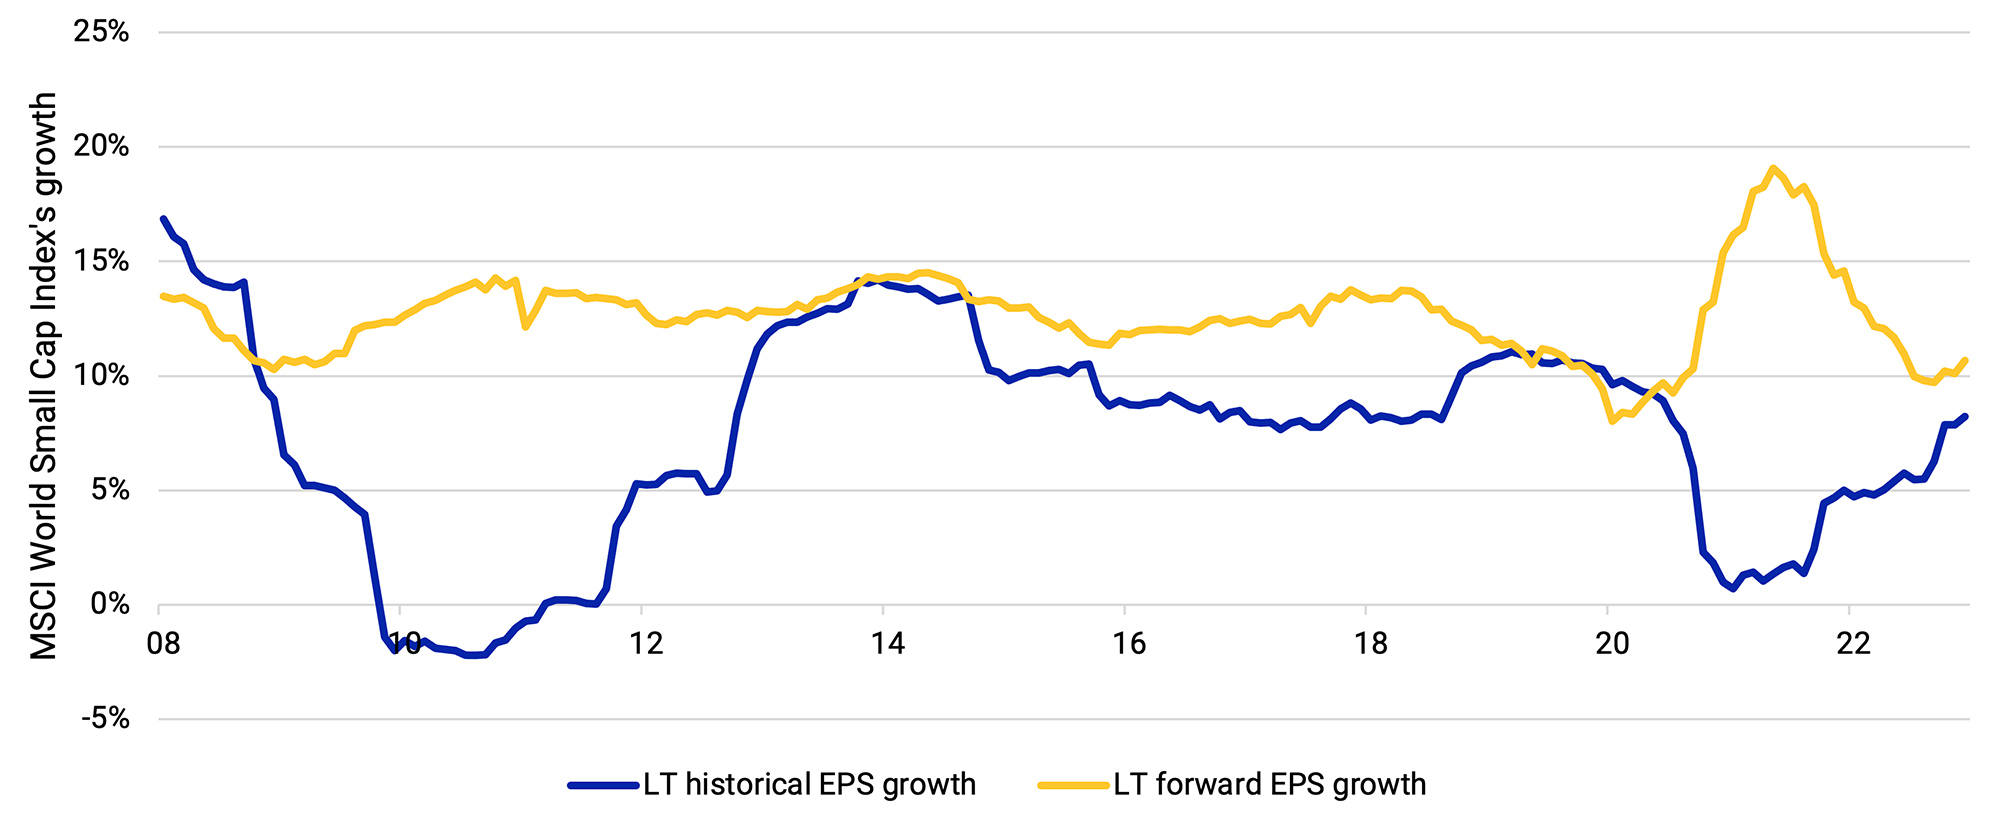
The exhibit shows the long-term historical and forward EPS growth of the MSCI World Small Cap Index from June 2008 through May 2023.
Small caps’ liquidity has improved over the last decade
Historically, the lower liquidity (ease and ability to trade without causing a major price impact) associated with many small caps has made implementing a small-cap allocation challenging. Lower liquidity can increase rebalancing costs and reduce market access. Our analysis showed that over the last 10 years small caps’ liquidity has improved. The following exhibit shows the reduction in the number of days required for rebalancing a USD 1 billion portfolio that tracks the MSCI World Small Cap and MSCI Emerging Markets Small Cap indexes. Part of the improvement could be due to the increase in the total size of the indexes’ market cap.
Interestingly, the average annualized traded-value ratio, or ATVR,2 of small caps at the aggregate index level has generally been higher than that of the larger companies in the MSCI World and MSCI Emerging Markets indexes. The historically higher ATVR of small companies indicates they have traded more frequently than larger companies.
Index-rebalancing days for small caps has fallen, implying liquidity has improved
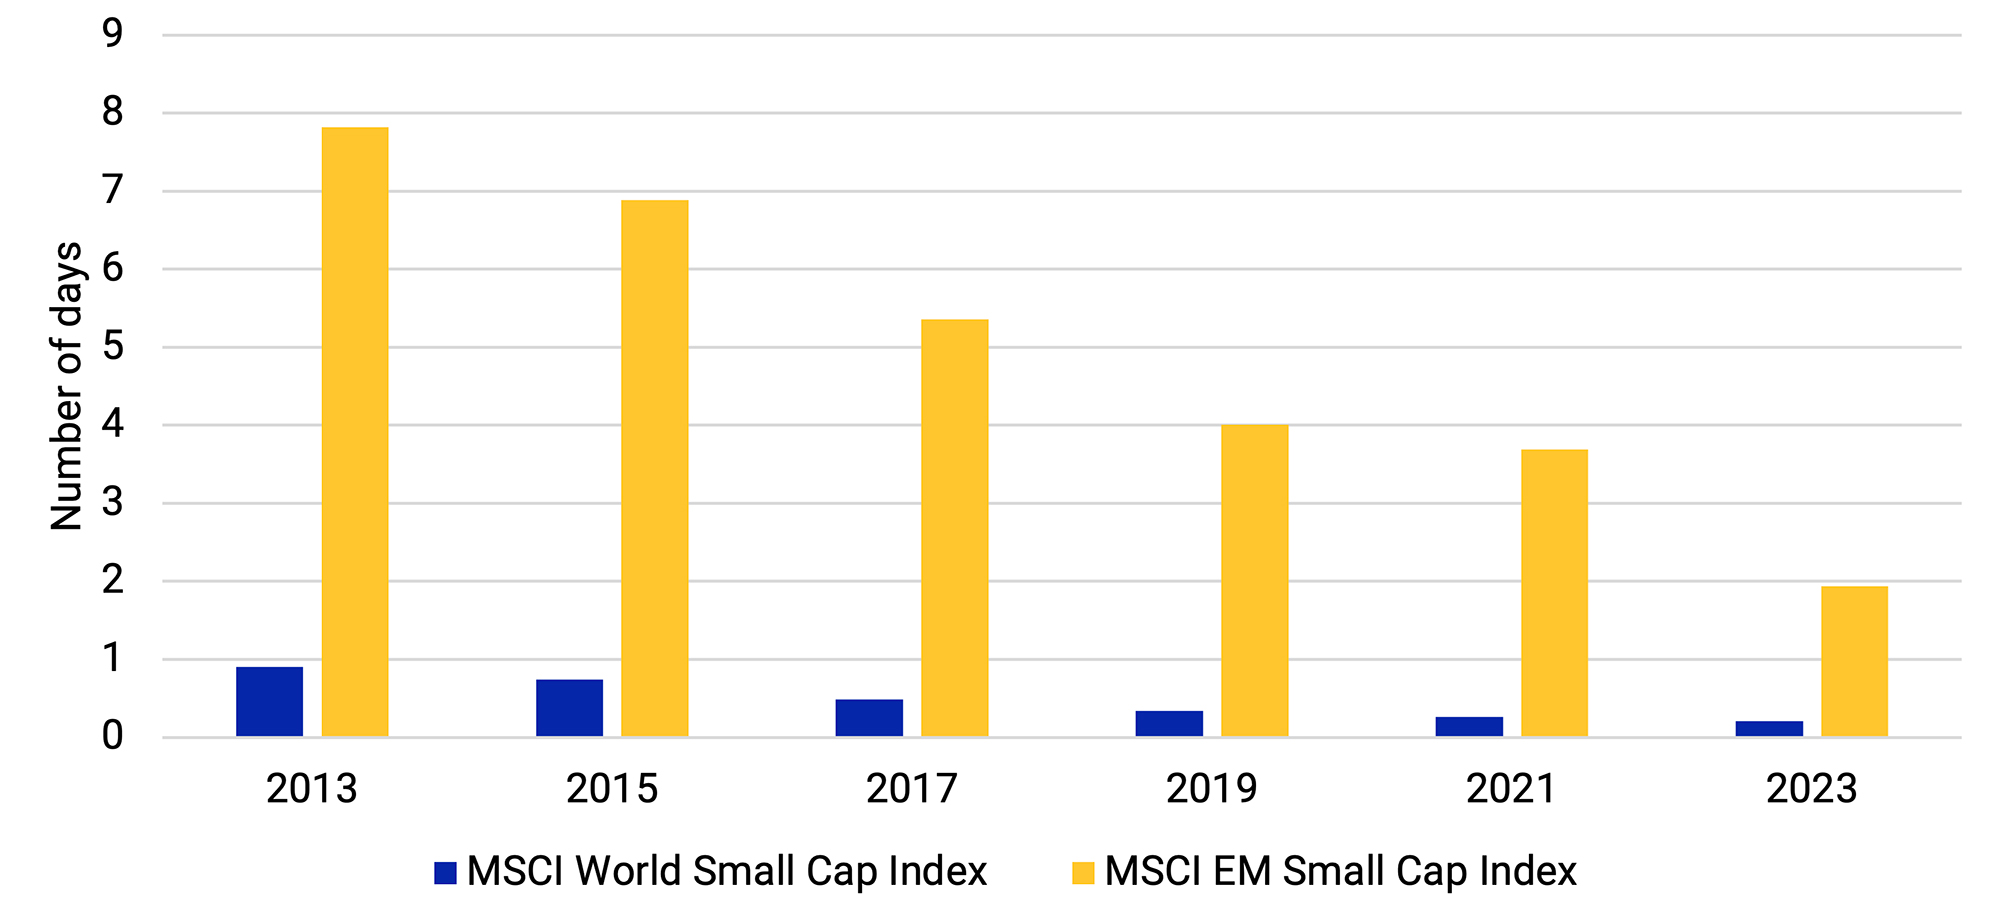
The exhibit shows the average number of days to complete 95% of all trading for the last four index reviews as of the end of May for each year, assuming a fund size of USD 1 billion and a maximum daily trading limit of 20%.
Small caps have historically benefited from the size premium, although with higher volatility. In the current economic environment, they are trading at a historically cheap valuation despite robust fundamentals. Opinions about the likelihood of a recession and its strength vary. Some investors are already looking ahead to brighter days when small caps have historically shone.
1“Global Economy to Slow Further Amid Signs of Resilience and China Re-opening.” International Monetary Fund, Jan. 30, 2023.
2The ATVR is a liquidity measure used to assess liquidity of securities in the MSCI Global Investable Market Indexes Methodology. The ATVR corresponds to the annualized traded value of a security relative to its free-float-adjusted market capitalization. In general, MSCI uses free-float-adjusted market capitalization after the application of any relevant adjustment factors, such as those applied due to low “foreign room” and liquidity-adjustment factors. MSCI uses consolidated trading values for securities listed in the U.S. and Canada and single-exchange trading values for listings in all other markets. Days with no trading volume are excluded when determining the median of the daily traded values. The trading volume and price used in the liquidity computation will only be captured from an eligible exchange.
Further Reading
Exploring Factor Investing in Emerging Markets
Style Bets, Not Stock Picks, Drove Returns in 2022
Value’s Lost Decade: Learning from Value Strategies’ Behavior over Two Contrasting Decades
