Asset managers devise investment strategies aimed at beating their benchmarks, but sometimes these strategies fall down in their implementation. Understanding exposures to different factors enables asset managers to make more informed decisions and allows institutional investors to evaluate the alignment of portfolios with their investment objectives. By using a fundamental factor model, we can see how a growth strategy might be hampered by unintended factor exposures.
We constructed two hypothetical long-short portfolios based on the definition of the growth factor in the Barra Global Equity Model for Long-Term Investors.1 We find that unintended exposures to other style factors had substantial impact on the returns of these two growth portfolios over our study period.
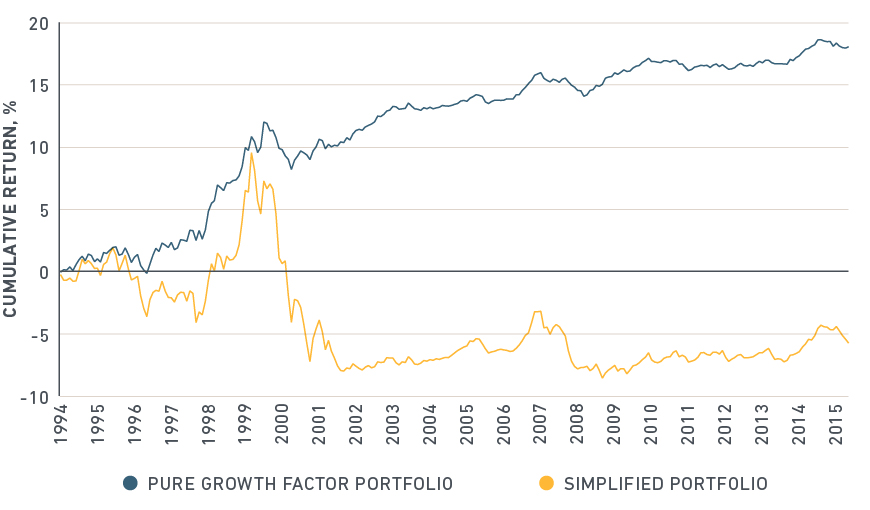
The first hypothetical portfolio is a pure growth factor portfolio. This portfolio served as our baseline as it had no exposure to factors other than growth. The second was a simplified growth portfolio that was country- and industry-neutral but did not control exposure to other style factors (except for growth).2 Both portfolios had the same exposure to the growth factor.
Comparing cumulative monthly returns of these portfolios shows that the pure growth implementation outperformed the simplified approach over the 20-year sample period ending May 2016. So the pure growth factor, net of country, industry and other style factors, earned a premium over our study period.
Performance of pure vs. simplified growth strategies

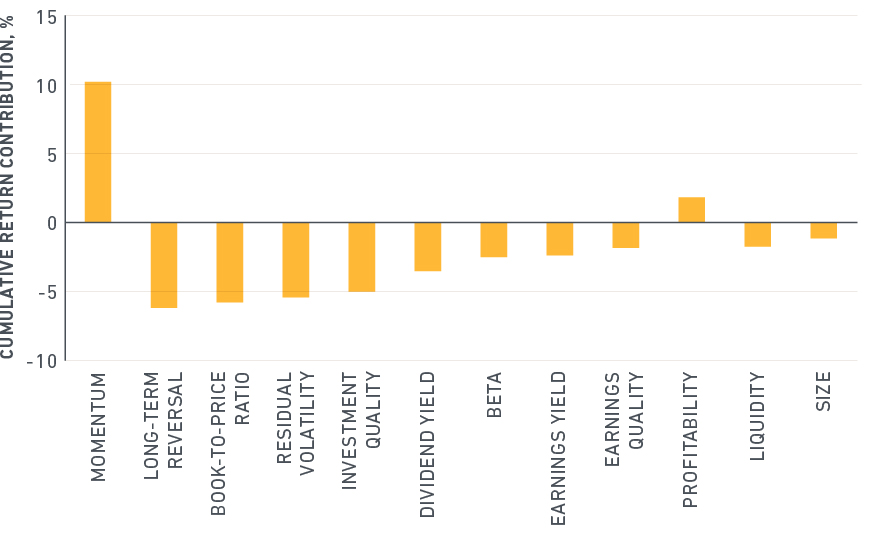
Why was historical performance so dramatically different for the simplified growth strategy? Due to its construction methodology, the simplified portfolio had incidental exposures to style factors other than growth. By selecting stocks that had higher-than-average growth without hedging other style factors, we implicitly chose companies with relatively high momentum, low value, low quality and high volatility characteristics. Taking momentum as an example, the simplified portfolio had a persistent positive exposure to this factor. We also know that the cumulative return of the momentum factor has been positive. This combination results in positive contribution of momentum to the return of the simplified portfolio. In contrast, the negative exposure to value (book-to-price ratio, long-term reversal and earnings yield) and quality (investment quality and earnings quality), and positive exposure to volatility (residual volatility and beta) detracted from returns.
Contributions of style factors to the simplified growth portfolio (1995 - 2016)

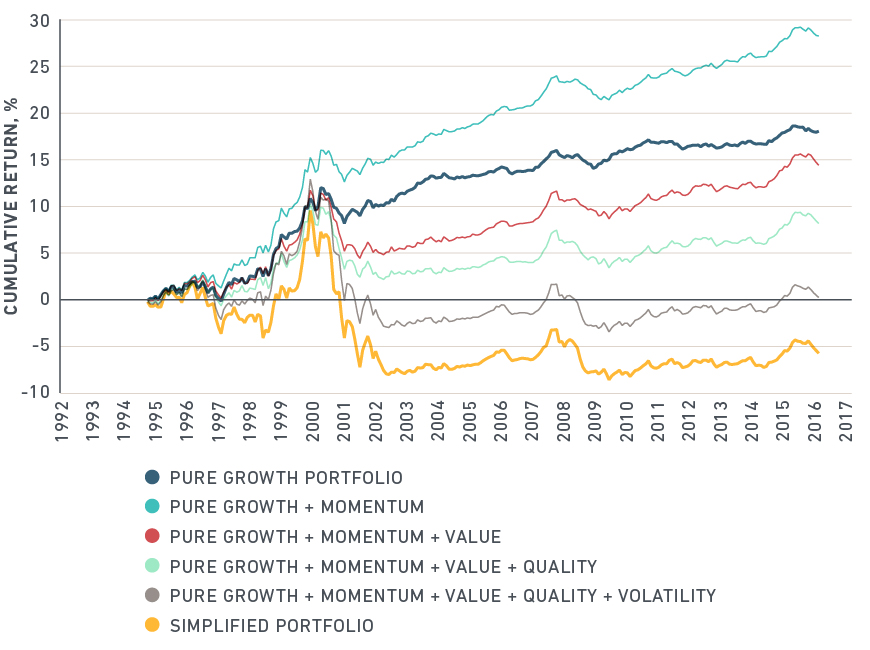
Below, we can see how different factor groups and individual factors affected returns of the simplified portfolio over time. The pure growth factor portfolio trended upwards during the sample period while the simplified portfolio return was mostly flat after 2002. The momentum factor enhanced performance throughout the period. On the other hand, value, quality and volatility factors made substantial negative contributions. The simplified portfolio reached its peak in 2000 and declined rapidly the following year, mostly explained by exposure to the volatility and value factor groups. During the financial crisis of 2008-09, the simplified portfolio’s negative return was amplified by other factors.
How style factor exposures affected simplified growth portfolio returns over time

The simplified portfolio return can be represented as the return of the pure growth factor portfolio plus contributions from all other style factors. On this plot, we start with the pure growth return and then show the cumulative effect of various factors. To make the figure clearer, we combined the contributions of some factors into factor groups. Book-to-price, long-term reversal and earnings yield form the value group. Earnings quality, investment quality, earnings variability, leverage and profitability define the quality group. The volatility factor group comprises beta and residual volatility factors.
Our analysis shows that unintended exposures to other style factors in the simplified growth portfolio impaired the strategy’s return. Similar analyses can be performed for other investment strategies and implementation methods, such as long-only growth or value portfolios. In a long-only implementation, the analysis will likely be more complex due to stock-specific contributions to return.
Portfolios reflect the implementation of specific investment strategies. While choosing stocks using investment indicators might seem to be the most intuitive way to construct a portfolio, it typically helps to understand sources of risk and other exposures that might reflect implicit factor bets. Fundamental factor models provide an essential framework to discover such exposures and see their effect on risk and return.
1 GEMLT defines growth exposure as a combination of three characteristics (descriptors): earnings and sales per share growth rates during the past five fiscal years and analyst-predicted long-term earnings growth.
2 GEMLT includes 248 different factors covering countries, industries, styles and currencies.
The author thanks Dimitris Melas and Andrei Morozov for their contributions to this post.
