- The plethora of U.S. programs for mortgage and housing relief could significantly reduce mortgage defaults, which have historically been a key driver of home-price depreciation.
- In the run-up to the pandemic, the state of the U.S. housing market appears to have been relatively sound, with the apparent absence of a housing-price bubble and excessive consumer leverage — two hallmarks of previous downward repricing.
- Even if COVID-19’s impact on U.S. GDP is comparable to that of the 2008 global financial crisis (GFC), MSCI’s housing-price model projects a baseline scenario of 5% to 10% depreciation under current variables, significantly less of a downturn than during the GFC.
The large economic shocks inflicted by the coronavirus could be comparable to or even exceed those of the 2008 global financial crisis. But could these shocks hurt U.S. housing prices as much as the GFC did? One potential outcome for the U.S. residential housing market would be relatively mild house-price depreciation (HPD) of 5% to 10%. Our models focus on three drivers of such a potential HPD outcome: early and broad mortgage- and housing-relief policy responses, the apparent lack of a preceding housing-price bubble and historically moderate mortgage- and consumer-debt levels.
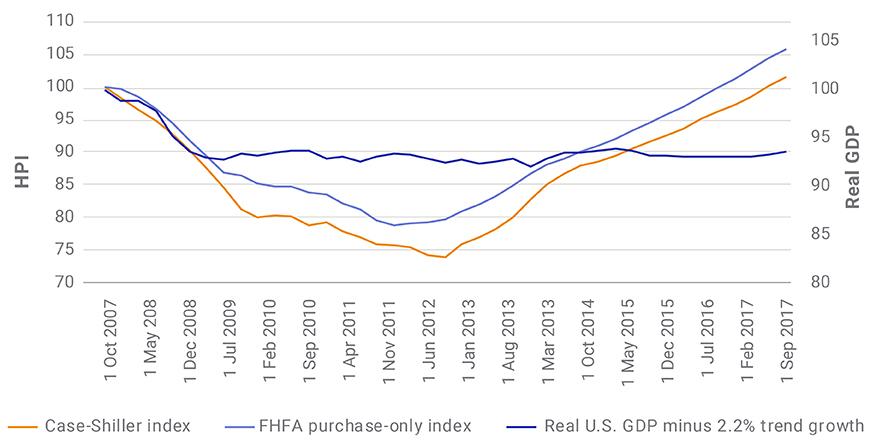
The exhibit below shows the real GDP (minus the 2.2% GDP trend growth rate), alongside U.S. home-price indexes, using 2007 as the baseline. The trendline GDP growth fell by about 8% in the GFC. In the wake of that crisis, the S&P/Case-Shiller U.S. National Home Price Index and the Federal Housing Finance Agency House Price Index dropped around 25% and 21%, peak to trough, respectively. The FHFA’s index is derived from the conforming mortgage market served by Fannie Mae and Freddie Mac, while the Case-Shiller index includes housing transactions in the subprime- and jumbo-loan market, which experienced much higher volatility during the GFC. The Case-Shiller index also excludes nondisclosure states, such as Texas, whose housing prices have been more stable historically. Unlike during the housing-bubble years between 2003 and 2007, the current mortgage market is dominated by the agencies.1
GDP slumped during the 2008 housing crisis and its aftermath

Source: FHFA, Case-Shiller, U.S. Bureau of Economic Analysis
The skyrocketing initial jobless claims in the past month have shown the tremendous devastation caused by the coronavirus.2 The Federal Reserve Bank of St. Louis estimated the U.S. unemployment rate could hit 32%, with 47 million layoffs.3 Investments subject to mortgage credit have historically been sensitive to future house-price trajectory. Based on TRACE data and MSCI’s model4 for credit-risk-transfer (CRT) securities issued by Fannie and Freddie, the tranches spread widened by around 600 basis points amid the general credit-spread widening across riskier assets.5 In the following, we draw on our models and historical data to analyze three potential drivers of U.S. housing prices.
Broad, and timely, policymaking response
Unlike at the beginning of the GFC, various policymakers and stakeholders — the federal government, state governments, regulators like the FHFA, the agencies and banks — have already announced a plethora of mortgage- and housing-relief programs. For example, the FHFA and agencies aim to help impacted homeowners with forbearance of mortgage payments, cessation of late fees and delinquency reporting, suspension of foreclosures, etc.6
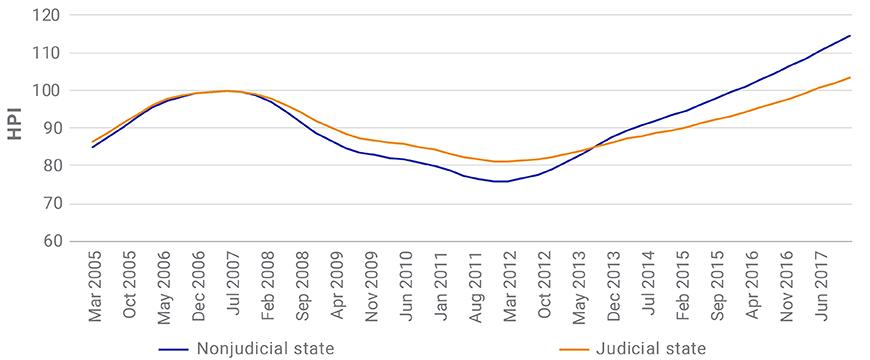
Forced home sales caused by high levels of mortgage default have often been pointed to as a key driver of depreciation during the GFC. Prior published research on the GFC housing crisis quantified this effect.7 The exhibit below shows the HPD in states that used judicial foreclosures (judicial states) — which require a legal process and tend to give borrowers more time — was significantly less than the HPD in states that did not (nonjudicial states).
Policy slowed the foreclosure rate during the GFC

Source: FHFA House Price Index
During the GFC, foreclosures were clogged up in judicial states.8 The practical effect of the slower judicial foreclosure process significantly pushed out the foreclosure timeline, reduced the glut of forced home sales and reduced the severity of HPD in judicial states. The new mortgage policies actively pursue these benefits9 — and so could help cushion HPD across the U.S.
The Fed’s open-ended quantitative-easing program could also significantly reduce mortgage rates and payments for U.S. homeowners who refinance. After the GFC, the Fed launched the Home Affordable Refinance Program (HARP) in 2009 and, in December 2011, modified and launched HARP 2.0, which was considered by many to be greater in effect. In 2013, prior research estimated that even the earlier HARP program reduced prime-mortgage defaults by as much as 40%.10 More detailed Fed research from 2018 estimated a reduction of 45%.11
Little evidence of a pre-coronavirus housing bubble
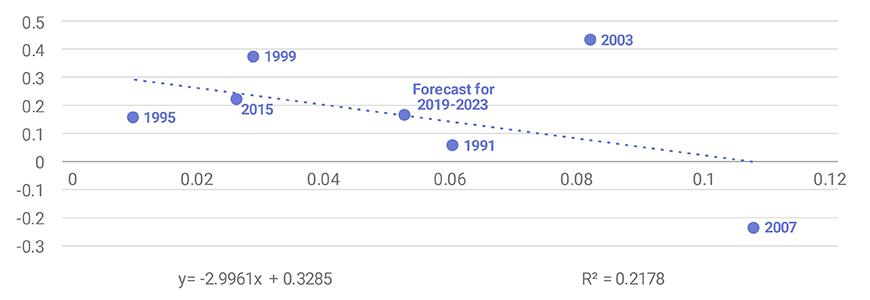
The HPD during the GFC housing crisis was unprecedented and nationwide, compared with the more localized, unemployment-driven episodes of depreciation such as that of the early 1990s in the Northeast and in Southern California. A key culprit during the GFC was the large house-price bubble that inflated between 2003 and 2006, as we quantified in a research paper drawing on MSCI’s house-price model.12 Using a simplified version of that model, the exhibit below shows the relationship between the forward returns of a home-price index and an annualized historical return, to identify large and seemingly anomalous house-price increases.
In the chart, 2007 is identified as a housing bubble: With the weighted annualized historical return at around 0.11, the model would have forecast a nearly 0% four-year total index return. This is roughly halfway between the actual return of -23% and trendline return of 20%. Before the coronavirus shock, the same model identified a return forecast for 2019-2023 of 18% — significantly higher than the 0% return forecast for the period preceding the GFC housing crisis. Consequently, assuming a similarity between the GDP shock of the GFC and the COVID-19, the model points to a potentially milder depreciation for housing assets than during the GFC.
Model analysis of four-year housing-price returns

Forward four-year cumulative house-price appreciation versus historical annualized home-price index’s return with a two-year exponential weighting. Source: FHFA House Price Index
Less consumer leverage than in 2007
Prior research identified consumer leverage as another key risk factor for the high rates of mortgage default and severe home-price depreciation during the GFC.13 For example, we estimated that subsequent housing and consumer debt were responsible for more than 30% of prime agency defaults during the GFC.
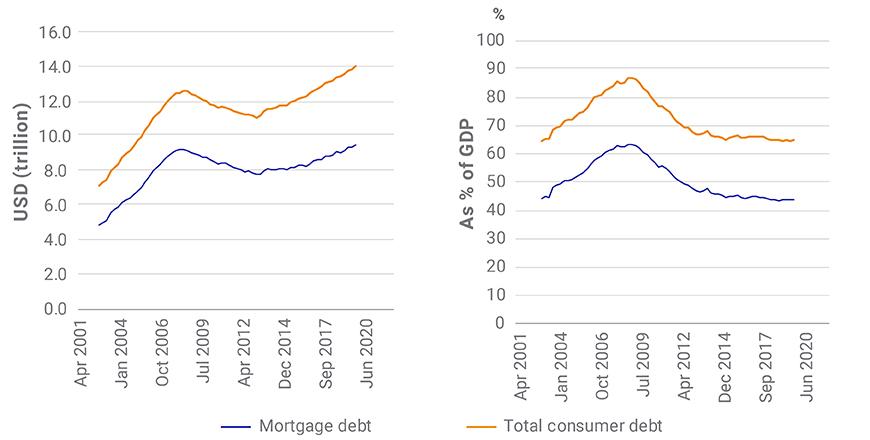
At USD 9.56 trillion and 14.15 trillion at the end of 2019, mortgage debt and total consumer debt in the U.S. have reached or surpassed 2007 peak levels.14 But as a percentage of nominal GDP, they are about 20% lower than in 2007, or at 2004 levels — i.e., before the housing bubble. The apparent absence of excessive leverage could protect against the level of mortgage defaults seen during the GFC.
Today’s consumer debt appears manageable in historical context

Source: Federal Reserve
If the coronavirus produced a similar GDP shock as the financial crisis, the recently announced mortgage and housing policies, combined with the apparent absence of a housing-price bubble and consumer over-leverage, could mean a home-price drop milder than that during the GFC, our models suggest.
1“US Bond Market Issuance and Outstanding.” Securities Industry and Financial Markets Association.
2“Unemployment Insurance Weekly Claims.” U.S. Department of Labor.
3Faria-e-Castro, M. “Back-of-the-Envelope Estimates of Next Quarter’s Unemployment Rate.” On the Economy Blog. Federal Reserve Bank of St. Louis, March 24, 2020.
4Yu, Y. 2019. “MSCI Agency Credit Risk Transfer (CRT) Models.” MSCI Model Insight.
5Eisen, B. and Otani, A. “The Fed’s Intervention Is Widening the Gap Between Market Haves and Have-Nots.” Wall Street Journal, April 7, 2020.
6“Mortgage Help for Homeowners Impacted by the Coronavirus.” Federal Housing Finance Agency, March 31, 2020.
7Zhang, J. and Tang, H. 2014. “Moral Hazard in Housing Policy: Takeaways from Judicial State Delinquencies.” Journal of Fixed Income.
8 Ibid.
9“FHFA Suspends Foreclosures and Evictions for Enterprise-Backed Mortgages.” Federal Housing Finance Agency, March 18, 2020.
10Zhang, J. “HARP refinance and payment reduction improve credit performance.” American Real Estate Society, April 11, 2013.
11Abel, J. and Fuster, A. “How Do Mortgage Refinances Affect Debt, Default, and Spending? Evidence from HARP.” Federal Reserve Bank of New York, February 2018.
12Zhang, J. and Zhang, L. 2019. “Model House Price Volatilities: Spatial and Temporal Structure.” Journal of Structured Finance.
13Zhang, J. and Tang, H. 2017. “Did the U.S. Housing Crisis Start in 2003? The Impact of Borrower Subsequent Debt.” Journal of Structured Finance.
14“US Bond Market Issuance and Outstanding.” SIFMA.
Further Reading
Coronavirus and financial markets
Could coronavirus lead to default contagion in CLOs
Model House Price Volatilities: Spatial and Temporal Structure
