
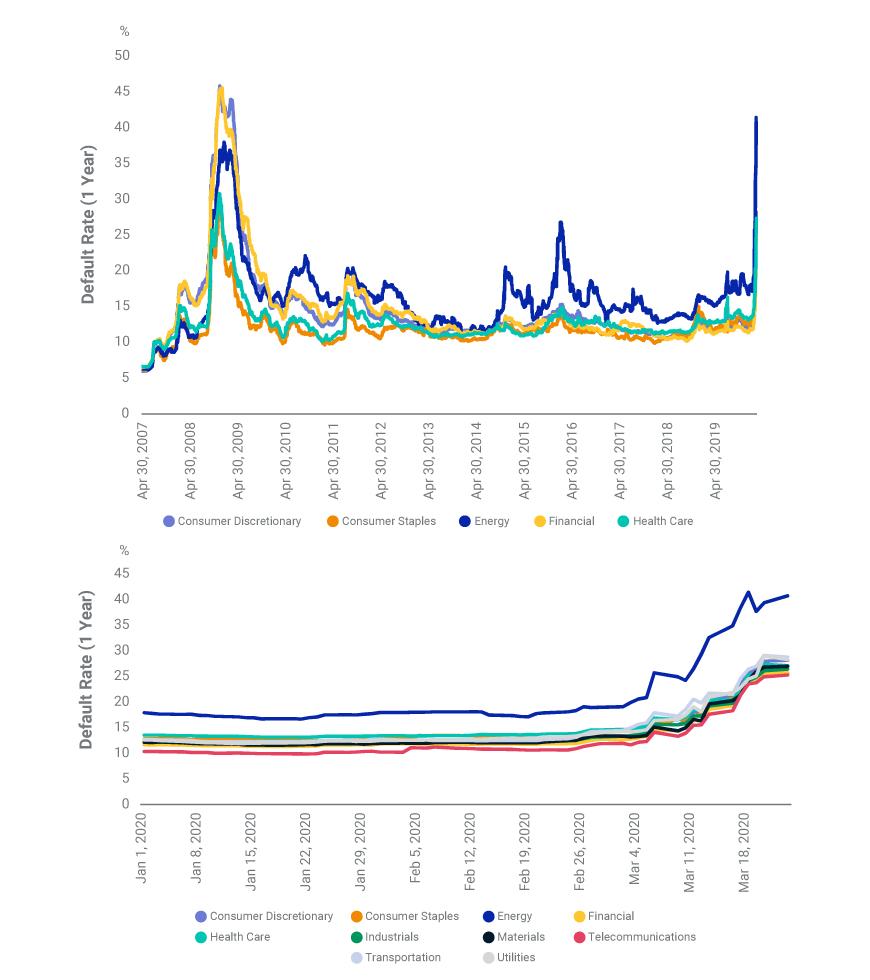
- Market-implied default rates, volatility of implied default rates and correlations between implied loan default rates increased sharply as the COVID-19 pandemic.
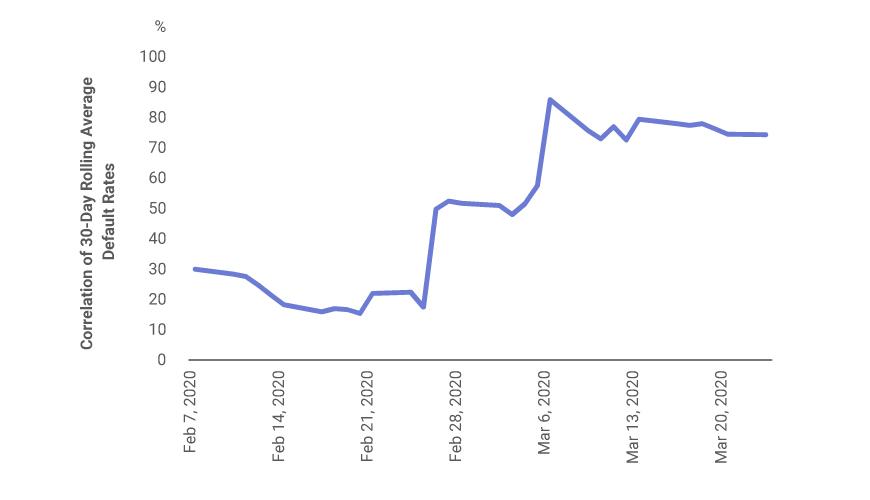
- Meanwhile, correlations between implied loan default rates across sectors reached and exceeded the levels during the 2008 global financial crisis.
- With high potential loan default rates, high default-rate volatilities and high cross-sector default correlations, the probability projected by our model for large joint loan defaults for CLOs has risen significantly in the example we tested.
The market for the more than USD 800 billion1 in collateralized loan obligations (CLOs) is under severe stress, with an observed price drop and widened spread.2 MSCI’s model for bank loans (of which CLOs are composed) shows a sharp increase in implied loan default rates.3 Default-rate volatilities and default correlations throughout sectors also reached very high levels. We applied MSCI’s CLO model (which is currently under development) to a sample 2019 CLO deal — one with more than 300 loans diversified across 10 sectors. The exhibit below shows that the probability of large total loan defaults has risen significantly under the current stressed market conditions, versus the mild credit environment of just a few months ago, according to the model’s projections. If current market conditions persist, total defaults for the longer term in this example could be unprecedented, as shown in the model’s 36-month projection.
Probability of joint defaults using sample 2019 CLO deal at one- and three-year horizons, under current market conditions
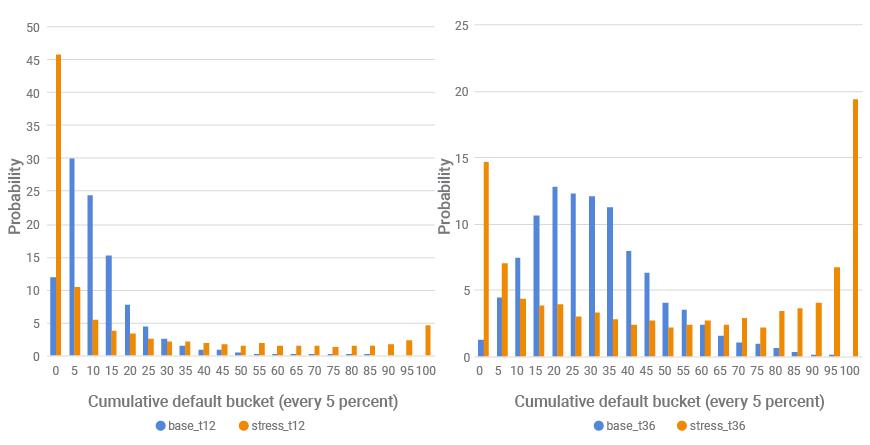
These projected high probabilities of joint loan defaults are driven by key risk factors currently seen during the COVID-19 pandemic: high loan default rates, default-rate volatility and high cross-sector correlation of loan defaults.
The sell-off of the leveraged-loan market significantly widened spreads, as spreads in the energy sector surpassed peak levels during the 2008 global financial crisis (GFC). The exhibit below shows the one-year default rates implied by bank-loan prices for selected sectors, based on MSCI’s leveraged-loan model.4 The current run-up in implied default rates started in late February, when the coronavirus started spreading widely in the U.S.
Implied default rates have risen sharply for all sectors
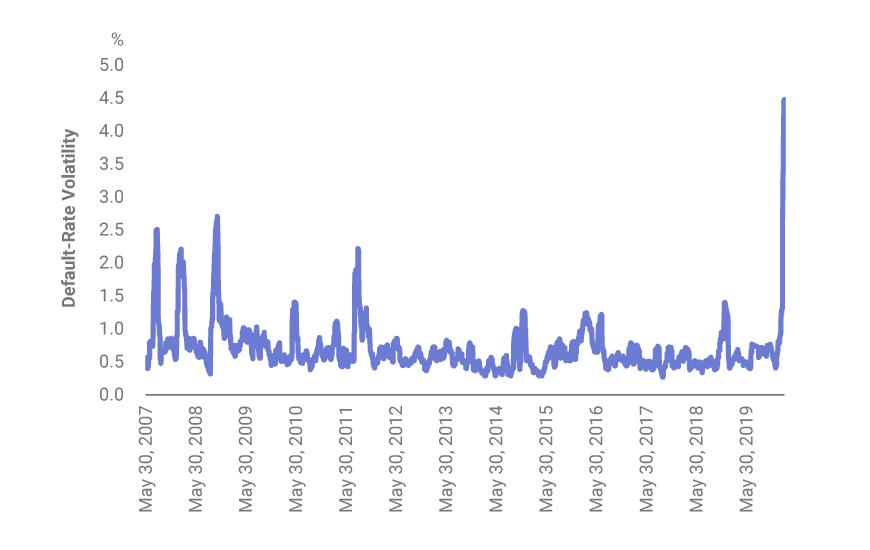
The exhibit below shows that the volatility of the implied default rates has also reached record levels. The high volatilities may imply greater market uncertainty and even higher default rates, if current conditions persist.
Volatility of implied-default rates surged during the pandemic
Loans’ credit spreads are computed from their market prices by discounting the expected cash flows via benchmark curves, and market-implied default rates are derived from credit spreads. The current historically high bank-loan spreads and volatilities may be caused in part by the market’s high-default expectation, as well as other market factors — liquidity and funding stresses, for example — so this methodology may overestimate future default rates. On the other hand, liquidity and funding stresses could increase underlying borrowers’ default rates by raising credit costs for the business entities whose loans make up the CLO market.
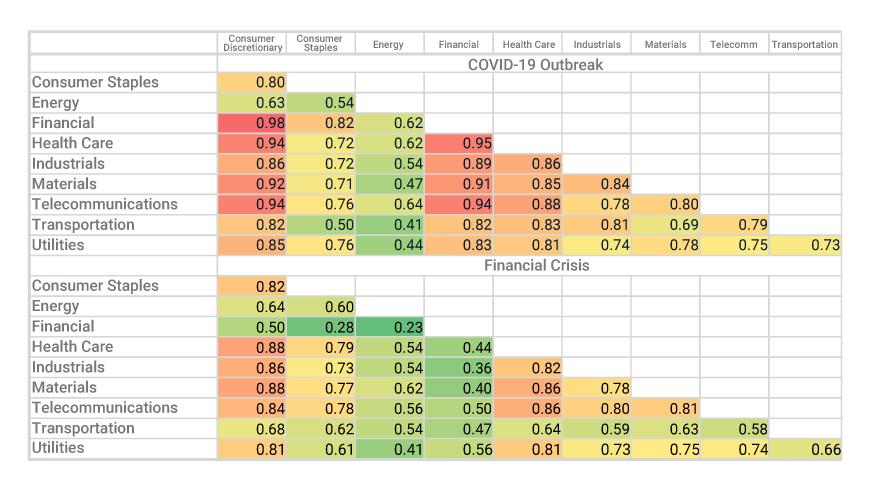
The coronavirus hit the economy and credit market broadly and, as a result, we see dramatically increased default correlations. The exhibit below shows the 30-day rolling average of the correlation between the sectors’ implied default rates. Within weeks, this cross-sector correlation rose to above 80% from below 30%.
Correlation of default rates increased dramatically
The exhibit below compares the cross-sector default-rate correlations — during the current COVID-19 pandemic and 2008 GFC — which have recently risen to high levels. Unlike the GFC, the economic shutdown caused by coronavirus hit abruptly and affected all sectors; and high default correlations might have reduced CLOs’ traditional diversification benefits.
Default-rate correlations have risen to historically high levels — and reduced diversification benefits
During periods of low default correlation, even with relatively high loan default rates, the tail probability of large total default is typically slim. If the current historically high default-rate correlations persist — combined with high loan default rates and default-rate volatility — our model indicates that a large portion of the examined pool may default and thereby threaten higher-credit tranches considered safe before the crisis.5 Higher asset correlation also poses the risk of introducing liquidity pressure on CLO managers.
The U.S. Federal Reserve’s recently enacted monetary-support measures include asset purchases and funding and liquidity support for investment-grade credit. Direct Federal Reserve support for high-yield corporate bonds and bank loans remains uncertain, and the recently announced U.S. economic-relief package may or may not benefit CLOs. CLO investors may therefore wish to stress test their portfolios, taking into consideration the possibility of high default rates, default-rate volatility and cross-sector default-rate correlations.
1 We calculated this figure based on data from the Securities Industry and Financial Markets Association and the Association for Financial Markets in Europe:
“US ABS Issuance and Outstanding.” SIFMA.
“Securitisation Data Report: European Structured Finance.” AFME.
2 Tempkin, A. “CLO Returns Drop Below Zero, New Deals Dry Up as Buyers Rattled.” Bloomberg, March 5, 2020.
3 DeMond, A., Faquiryan, H., Rueda, M., and Spray, A. 2018. “Leveraged Loans.” MSCI Model Insight.
4 Default rates were derived using the bank-loan model's spreads and the standard assumption for the first-lien recovery rate of 70%. Recent covenant-lite loans likely have much lower recovery rates and correspondingly lower implied default rates.
5 The additional credit support from excess spreads and cash-flow rules needs to be analyzed on the security level.
Further Reading
Coronavirus and financial markets
Navigating market volatility with agency MBS models
Coronavirus and a potential MBS convexity whipsaw
