This blog post originally appeared on Burgiss.com. MSCI acquired The Burgiss Group, LLC in October 2023.
In our previous article, we documented the growing ubiquity of sub lines in private capital — particularly for real estate, buyout, and debt funds — and provided evidence that approximately three-quarters of buyout and real estate funds are drawing on sub lines in their first years of life. In this article, we use the same holdings data from the Burgiss Manager Universe (BMU) to explore how intensively funds draw on their sub lines — that is, the size of the sub-line balance relative to total limited partner (LP) commitments.[1] Sub-line intensity is a critical determinant of how sub lines will affect internal rates of return (IRRs).[2] As with the rapid proliferation of sub lines, we find that funds have substantially increased their sub-line balances relative to fund size, indicating an increase in the size of sub-line draws or a willingness to carry a balance over longer timeframes.
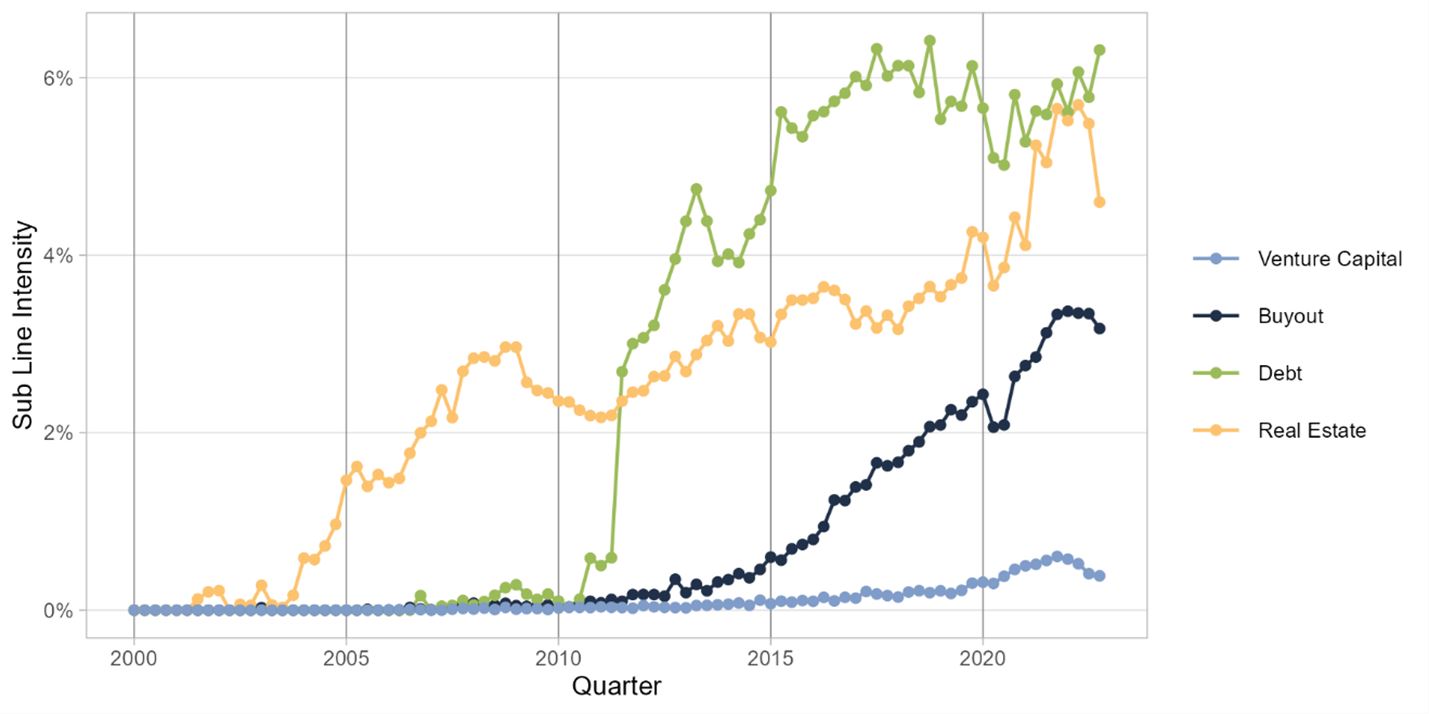
To measure sub-line intensity, we use a fund’s sub-line balance as a fraction of fund size (total LP commitments) and plot its trajectory in exhibit 1.[3] The most recent sub-line intensity for buyout funds is roughly eight times that of venture capital funds. The peak for real estate funds — just shy of 6% — is larger still, but debt funds are, fittingly enough, the clear leaders when it comes to reliance on sub lines, with the average debt fund reporting a sub-line balance exceeding 6% of fund size at the end of 2022.[4]
Notably, we observe a recent apparent collapse in sub-line intensity for real estate funds, which reflects a decline in sub-line balances among young funds. Venture capital funds also experienced a decline in sub-line intensity around the same time, likely corresponding to the downturn in deal activity after a very busy 2021. While it is too soon for the data to reflect the fallout from the collapse of Silicon Valley Bank in March 2023, we will keep an eye on it in the coming months.
Mean sub-line balance as a fraction of fund size over time

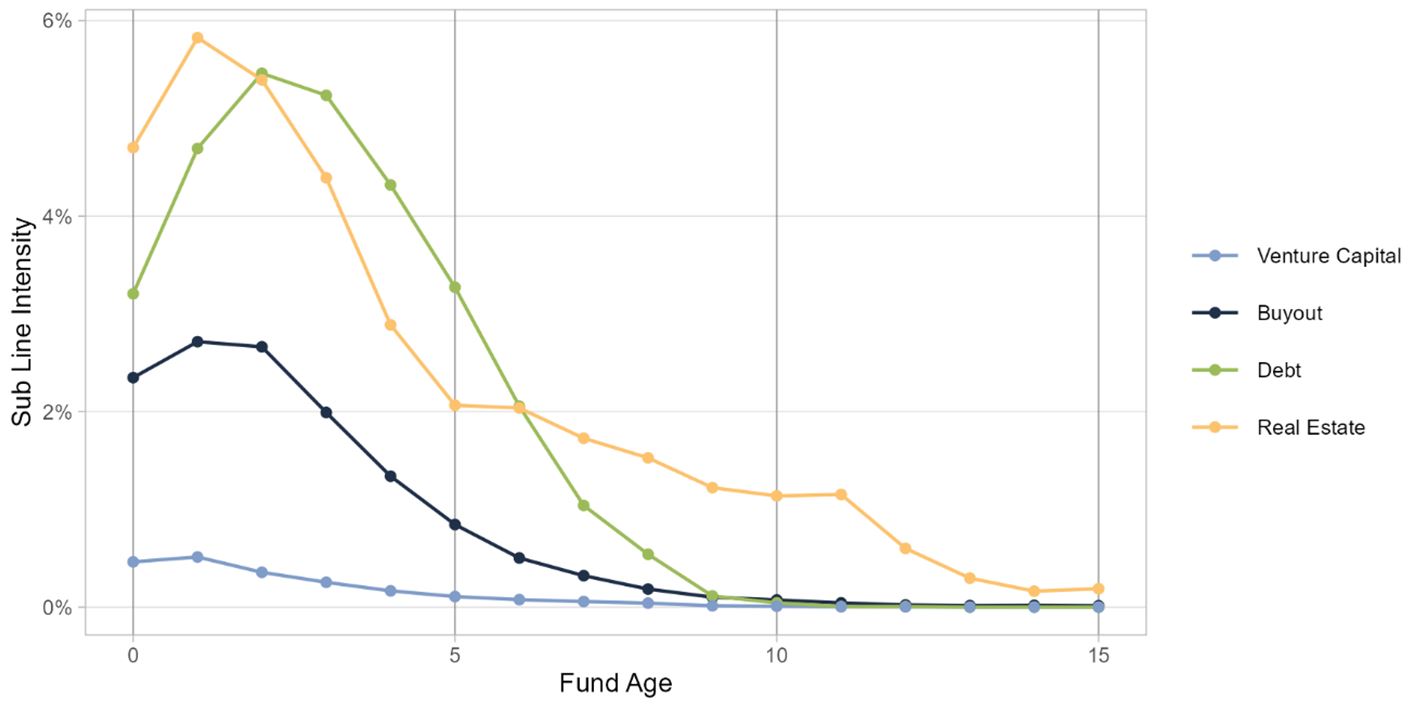
This broader look at sub lines at the asset-class level is just part of the story. Funds draw most heavily on their sub lines during their investment periods, as demonstrated in exhibit 2. In contrast to our findings on sub-line usage, sub-line intensity decays quite quickly; this makes sense because funds can continue to use fund lines for small fees, but the big investments are behind them by age five.[5] However, this means that exhibit 1 understates the rise of sub lines because it reflects a growing number of older funds that are past their most sub-line-intensive years.
Mean sub-line balance as a fraction of fund size at each age

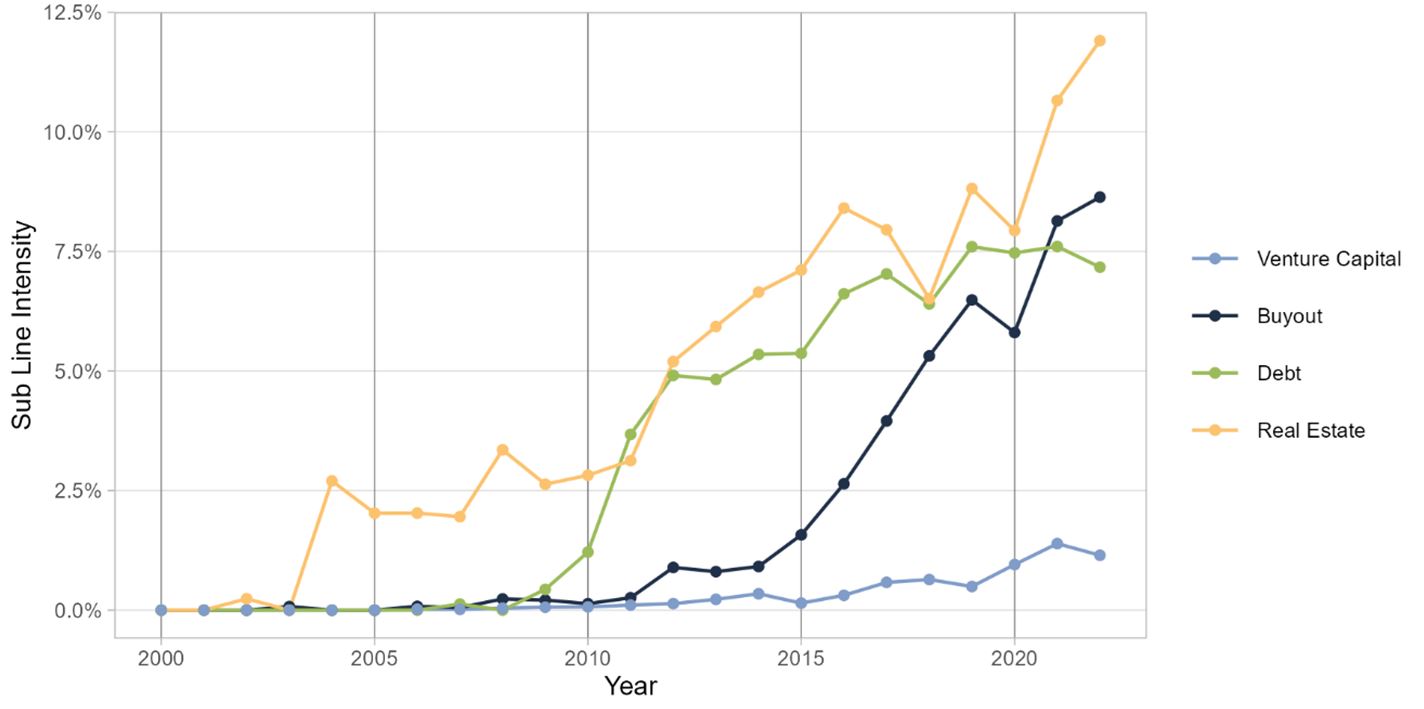
To address the changes in fund age composition that complicate exhibit 1, we turn to one-year-old funds in exhibit 3. Sub lines clearly took off first with real estate funds, starting in the early 2000s. While debt and buyout funds started using sub lines around the same time, debt funds jumped headlong into sub lines; in contrast, buyout funds were slower to ramp up in intensity. Venture capital funds remain far behind, almost an order of magnitude behind debt funds in 2022. As of the most recent data, the average one-year-old buyout, debt and real estate funds are all carrying sub-line balances in the range of 7-12% of fund size. Compared to 10 years ago, that means there was a nearly 50% increase in sub-line intensity for debt funds, a 100% increase for real estate funds, and a nearly tenfold increase for buyout funds.[6]
Mean sub-line balance as a fraction of fund size for one-year-old funds each year

Over the past decade, sub lines have become a critical tool for cash-flow management across buyout, debt and real estate funds. While venture capital funds are increasingly exploring sub lines, they lag far behind other private market strategies. This shift toward using sub lines more intensively represents a major change in the timing of capital calls, with important implications for LPs.

