- Tracking municipal-bond benchmarks can involve evaluating tens or even hundreds of thousands of securities along many dimensions, such as credit rating and taxability.
- We conducted a horse race between a standard technique for constructing muni portfolios and a factor-model-based approach for tracking the same benchmark.
- We found that muni investors were able to use factor models to achieve approximately the same returns, but with less tracking-error volatility, especially during the COVID-19 crisis.
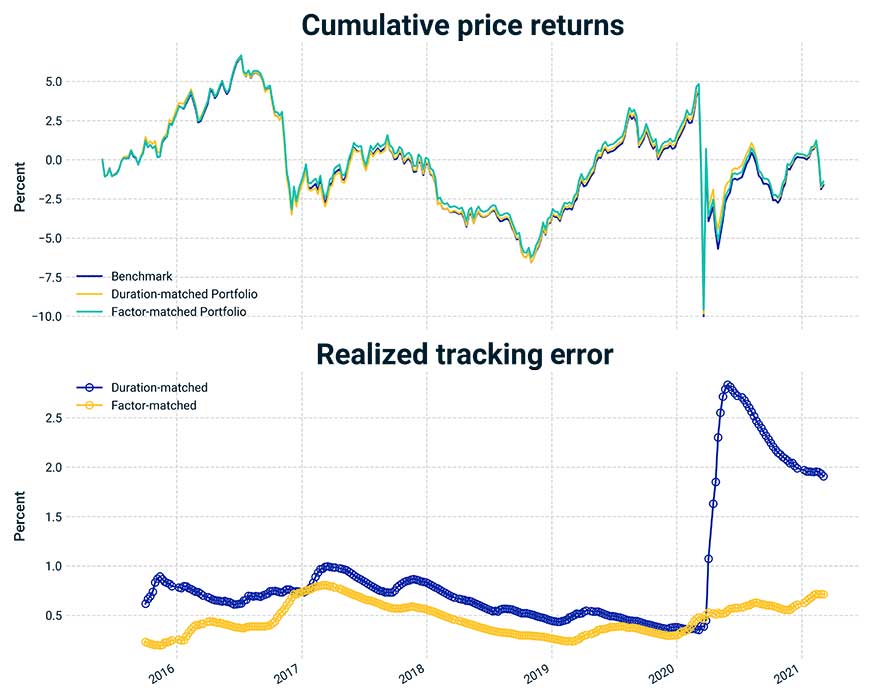
The sheer number of constituents within municipal-bond benchmarks poses unique challenges to the funds and managers tracking them. In this blog post, we compare a duration-matched tracking portfolio against one that matches more-granular factor exposures. Each portfolio’s benchmark comprises large, liquid tax-exempt muni bonds issued in New York state. Over a longer period of time, both methods captured benchmark returns very well,1 but the factor-model-based approach produced 30% less tracking-error volatility on average — and up to 50% less during the depths of the COVID-19 crisis. Muni investors may be able to leverage these new tools to better understand their portfolios and make sure the market compensates them for bearing systematic risk.
Today’s muni market
The municipal-debt market in the U.S. has many features distinct from those of the corporate- and sovereign-bond markets. The most important of these distinctions is that muni-bond payments are exempt from federal taxation,2 default rates have been extremely low and the market comprises USD 4 trillion of notional value across one million individual securities of significantly differing liquidity.3
Muni-bond indexes are vast. For example, a hypothetical index of large4 general-obligation bonds issued by municipalities in California would comprise more than 27,000 bonds. In turn, these enormous benchmarks generate unique portfolio-construction problems.
Constructing muni portfolios
We investigated whether and how a factor-model-based approach to constructing muni portfolios could help overcome some of these unique challenges. Our hypothetical benchmark comprised tax-exempt general-obligation and revenue bonds from issuers in New York state. Each bond had to be between USD 25 million and 30 million in size. Using the MSCI factor model and portfolio optimization, we then built a portfolio to track the benchmark. As an alternative, we created another tracking portfolio designed to match the duration profile of the benchmark.5
The exhibit below compares cumulative returns of the benchmark, the factor-optimized portfolio and the duration-matched portfolio.6 It’s clear that both of the tracking portfolios approximated the benchmark’s returns very well. However, the bottom panel of the exhibit highlights a large discrepancy in realized active risk between the two tracking portfolios. In particular, the duration-tracking portfolio had a significant increase in active risk as the COVID-19 crisis set in during March 2020.
Tracking the portfolios’ performance

The top panel shows cumulative returns for the benchmark and tracking portfolios. The bottom panel is the annualized tracking-error volatility (active risk) for our tracking portfolios.
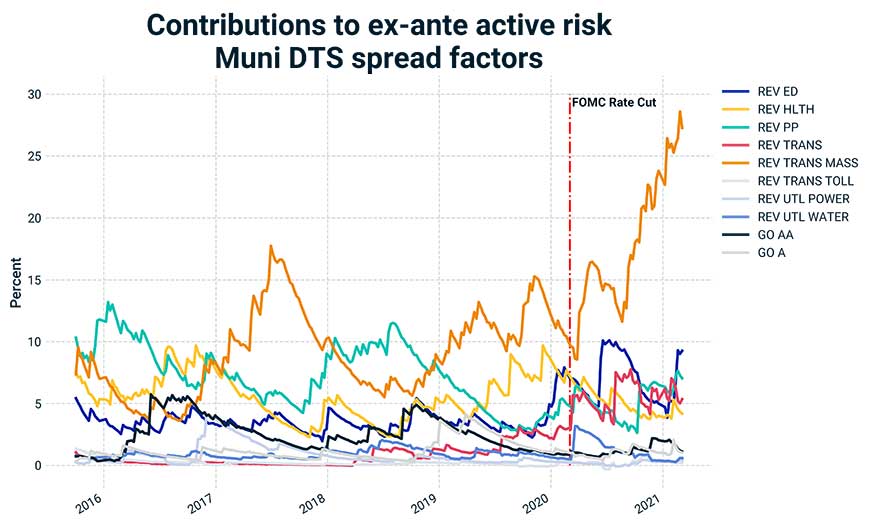
The exhibit below drills down into the factor exposure of the duration-matched tracking portfolio, revealing a large ex-ante contribution to active risk from the portfolio’s overweight to mass-transit bonds. This overweight, combined with the COVID-19-induced sell-off of mass-transit muni bonds, generated significant realized tracking error for the portfolio. In contrast, the factor-based portfolio avoided this pitfall by matching benchmark risk factor by factor — hence having zero ex-ante active exposure to the spread factors.
Duration-matched portfolio’s active risk doubled from transit bonds through COVID-19

The marginal risk contribution was broken down by muni bonds’ duration-times-spread factors.
Final words
Managing muni risk with factors may be a new concept for many investors. Our empirical results show that investors could have benefited from using a factor model over an alternative approach that simply matched durations. The benefit was particularly prominent during the early-COVID-19 period, when market volatility was exceptionally high.
Looking forward, the fixed-income stage is set for the coming summer. It features a Federal Reserve determined to continue raising short-term rates, inflation at multidecade highs and municipal issuers flush with cash.7 The possibility of spikes in market volatility is very real, and muni investors may want to explore the use of factor models when building muni portfolios.
1 From May 29, 2015, to March 5, 2021, the cumulative price return was -1.61% for the benchmark portfolio, 0.91% for the duration-matched portfolio and -1.39% for the factor-matched portfolio.
2A small number of muni bonds are taxable — for example, the Build America Bonds.
3For reference, the USD corporate-bond market is composed of USD 12 trillion of notional value across 15,000 securities.
4Greater than USD 25 million.
5Both the duration-matched and factor-based portfolios were constrained to hold no more than 40% of the total number of bonds in the benchmark, and the weekly turnover is constrained to be 5% (a 1%-turnover constraint was also simulated, and the results were similar). Both portfolios were optimized to minimize the ex-ante active risk.
6Note that our method for computing muni-bond durations uses muni-market-specific implied volatilities to account for options embedded in callable muni bonds.
7Gillers, Heather. “Cash Floods Municipal-Bond Market.” Wall Street Journal, Jan. 2, 2022.
Further Reading
The MSCI Municipal Yield Curves (client access only)
The MSCI Municipal Debt Factor Model (client access only)
Bond-Index Replication While Navigating Volatility
