Extended Viewer
Risk Management in Climate-Related Underwriting
Growing wildfire risk and inflation have been blamed for State Farm Insurance and Allstate Corp.’s decision to halt new homeowner insurance in California.1 With climate change exacerbating extreme-weather events, we may see further destabilization in the insurance market if claims outpace insurers’ ability to adjust premiums in regions with intensified catastrophe risks.2
Assessing insured assets against different hazards and climate scenarios
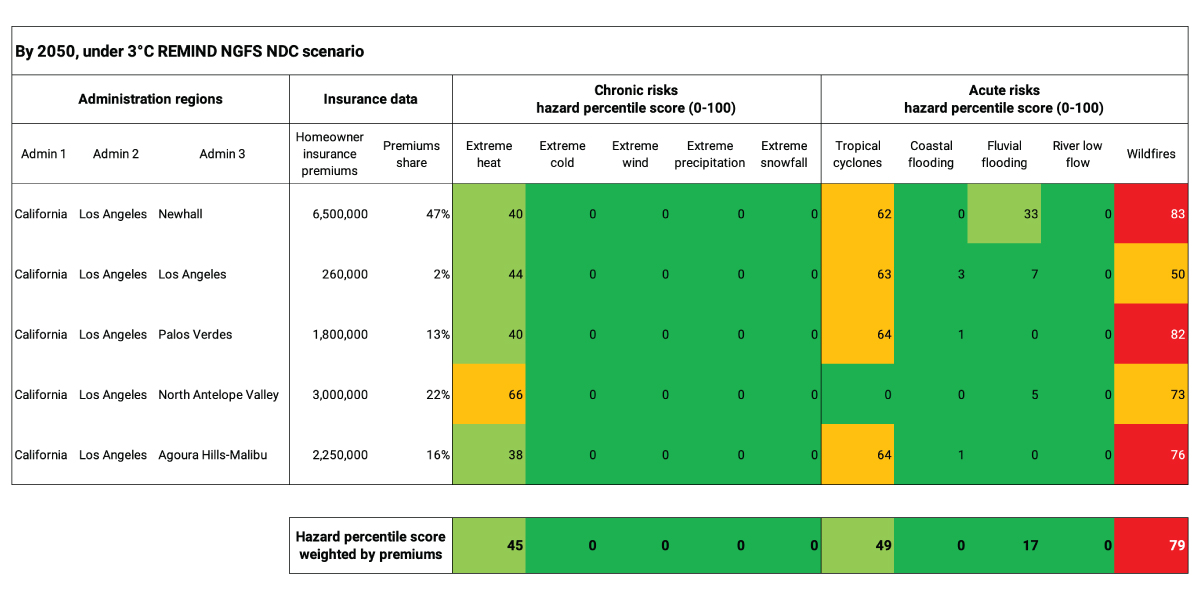
To generate a forward-looking climate-exposure assessment of insured assets to different hazards and climate scenarios, we combined MSCI’s Regional Physical Hazard Metrics3 and insurance-underwriting data. For a portfolio of insured assets, an aggregate exposure can be reached through a premium-weighted exercise. Other risk exposure metrics, such as sum-assured, may also be used. Such analyses could support insurance companies’ climate-related underwriting risk management.
Using wildfire as an example, we found that by 2050, 44% of U.S. counties could have a hazard-percentile score over 75, using the 3°C REMIND NGFS NDC scenario. A score of 75 for an asset in the corresponding region implies the asset experiences more wildfires than 75% of the assets in the reference dataset (i.e., assets in the MSCI ACWI Index under current climate conditions).
Property-insurance policies directed to these regions may face higher wildfire exposure. Intensified physical climate risks may put additional pressure on insurance companies’ profitability and leave households under-insured if insurance companies continue to pull back.
Quantifying physical-hazard risk in five select regions of Los Angeles

Wildfire in the US by 2050, under 3°C REMIND NGFS NDC scenario

1 Juliana Kim. “State Farm has stopped accepting homeowner insurance applications in California.” NPR, May 28, 2023.
2 Renee Cho. “With Climate Impacts Growing, Insurance Companies Face Big Challenges.” Columbia Climate School, Nov. 3, 2022.
3 MSCI’s Regional Physical Hazard Metrics provides hazard metrics for individual chronic and acute physical risks from climate change per region, expressed by a Regional Hazard Percentile Score (0-100). The Regional Hazard Percentile Score is calculated for a total of 100,000+ regions across different levels of granularity (i.e., administration levels) ranging from country level (admin 0) to city level (admin 3), where available.
Related content
Webinar: How Investors Can Leverage Regional Physical Hazard Data
Join us to learn more about how our recent datasets can help investors identify their potential exposure to the most pending climate-related hazards.
Watch on-demandPodcast: California Gets Harder to Insure and the NZIA Gets Smaller
Under pressure from wildfires and inflation, State Farm has stopped issuing new homeowner policies in California.
Listen to podcastUnderwriting the Biodiversity Crisis
There is a link between biodiversity loss and higher underwriting risks. This relationship is especially clear for insurance covering floods, crops, life, health and environmental liabilities.
Read more