Although global uncertainties remain high, the CBOE VIX Index — also known as the “fear index,” recently reached its lowest level since 1993. Some observers have questioned whether VIX remains a reliable indicator. In the first of a series of posts examining market risks, we consider possible drivers of this historically low volatility through the lens of MSCI factor models and examine average correlation between stocks — a key driver of market volatility.
In short, we find that three measures of volatility — implied (from VIX), realized and forecast (from the MSCI Barra US Total Market Equity Trading Model (USFAST)1 — have been consistent with each other and reflected market conditions. We also find that correlations between stocks dropped to low levels in 2017, contributing to low market volatility.
Historically, a volatility risk premium (VRP) of VIX over realized volatility has existed. If the VRP were to shrink, that could create an artificially low VIX. We test to see if this is currently a key driver of low VIX.
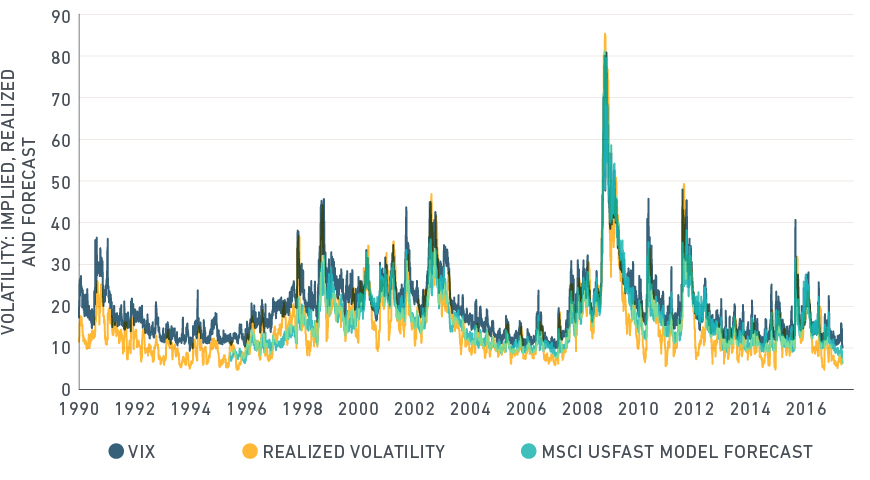
In the top panel of the below exhibit, we plot VIX along with realized volatility, defined by standard deviation of trailing 30-day returns, and the forecast volatility from the MSCI Barra USFAST model. As expected, we see that on average the USFAST forecast was about equal to realized volatility, and the forecast led realized (trailing) volatility. We also note the relative stability of the USFAST forecast compared to realized volatility. In the lower panel, we display the VRP constructed from implied minus realized volatility and also implied minus forecast volatility.
U.S. market volatility varies over time


Top panel: VIX, realized and USFAST model forecast volatility over time. Bottom panel: VRP between VIX and realized volatility and VIX and forecast volatility over time. All measures of volatility – implied, realized and forecast are at historically low levels, but all have been low for extended periods before and the VRP is consistent with history.
While all three measures of volatility are at historically low levels, these levels are not unprecedented. There were extended periods in the mid-1990s and 2000s where volatility was at low levels. Implied volatility, represented by VIX, has generally been above both realized and forecast volatility through the entire period and into 2017.
We have conducted similar analyses for emerging markets and international developed markets (represented by EAFE) using data from exchange-traded funds tracking the respective MSCI indexes. We calculate implied volatility from the average implied volatility from an at-the-money (ATM) put and ATM call option interpolated to a constant 30 days to maturity, and calculate trailing 30-day realized volatility from the ETF daily returns.
In EAFE, since 2010 (excluding the 2008 financial crisis) the VRP averaged 0.8 while the average for 2017 through May 5 was 3.0. In emerging markets, the corresponding values were 1.8 since 2010 and 3.2 in 2017. Thus, the volatility risk premium has been maintained in global markets.
Developed and emerging market volatility over time


Realized and implied volatility and the VRP for emerging markets and EAFE.
So, if a shrinking VRP is not driving down VIX, what about correlations between stocks? When correlations are low, the diversification effect will drive down volatility. We can break down total market volatility into a security-level variance component and a covariance component. If the average pairwise correlation between securities is low, that drives down the covariance component. Below, we plot the average pairwise correlation between securities implied by such a decomposition based on trailing 90 days of realized security and market returns. Indeed, the average pairwise correlation has dropped to a low level of about 0.15 in 2017, which has helped drive down total volatility.
Declining stock correlations drive down volatility

Average pairwise correlation between U.S. stocks implied by decomposition of volatility into security-level variance and covariance components.
In short, we find that both implied volatility and realized volatility have recently been at historically low levels in 2017 in global markets. The volatility risk premium has remained intact and at normal levels in all markets we examined. The average pairwise correlation between stocks has also dropped to low levels in 2017, which has contributed to low volatility.
1Bayraktar, M., I. Mashtaler, N. Meng, S. Radchenko. (2015.) “Barra US Total Market Equity Trading Model Empirical Notes.” MSCI Model Insight.
The author thanks Dimitris Melas, Peter Zangari and Leon Roisenberg for their contributions to this post.
Further reading:
Has the growth factor earned a premium?
Which factors are more time-sensitive?
