A rise in relative valuation of the low volatility factor and a concurrent fall-off in the value factor have led some institutional investors to wonder anew whether it makes sense to time their exposures to systematic strategies. In short, has value become so cheap (relative to the market) that investors may want to pivot toward it? And does a relatively rich valuation for minimum volatility tell investors it’s time to back off?
To help answer those questions, we examined the relative performance of MSCI World Factor Indexes (which proxy the performance of long-only factor portfolios) against the MSCI World Index over successive five-year investment horizons going back four decades.
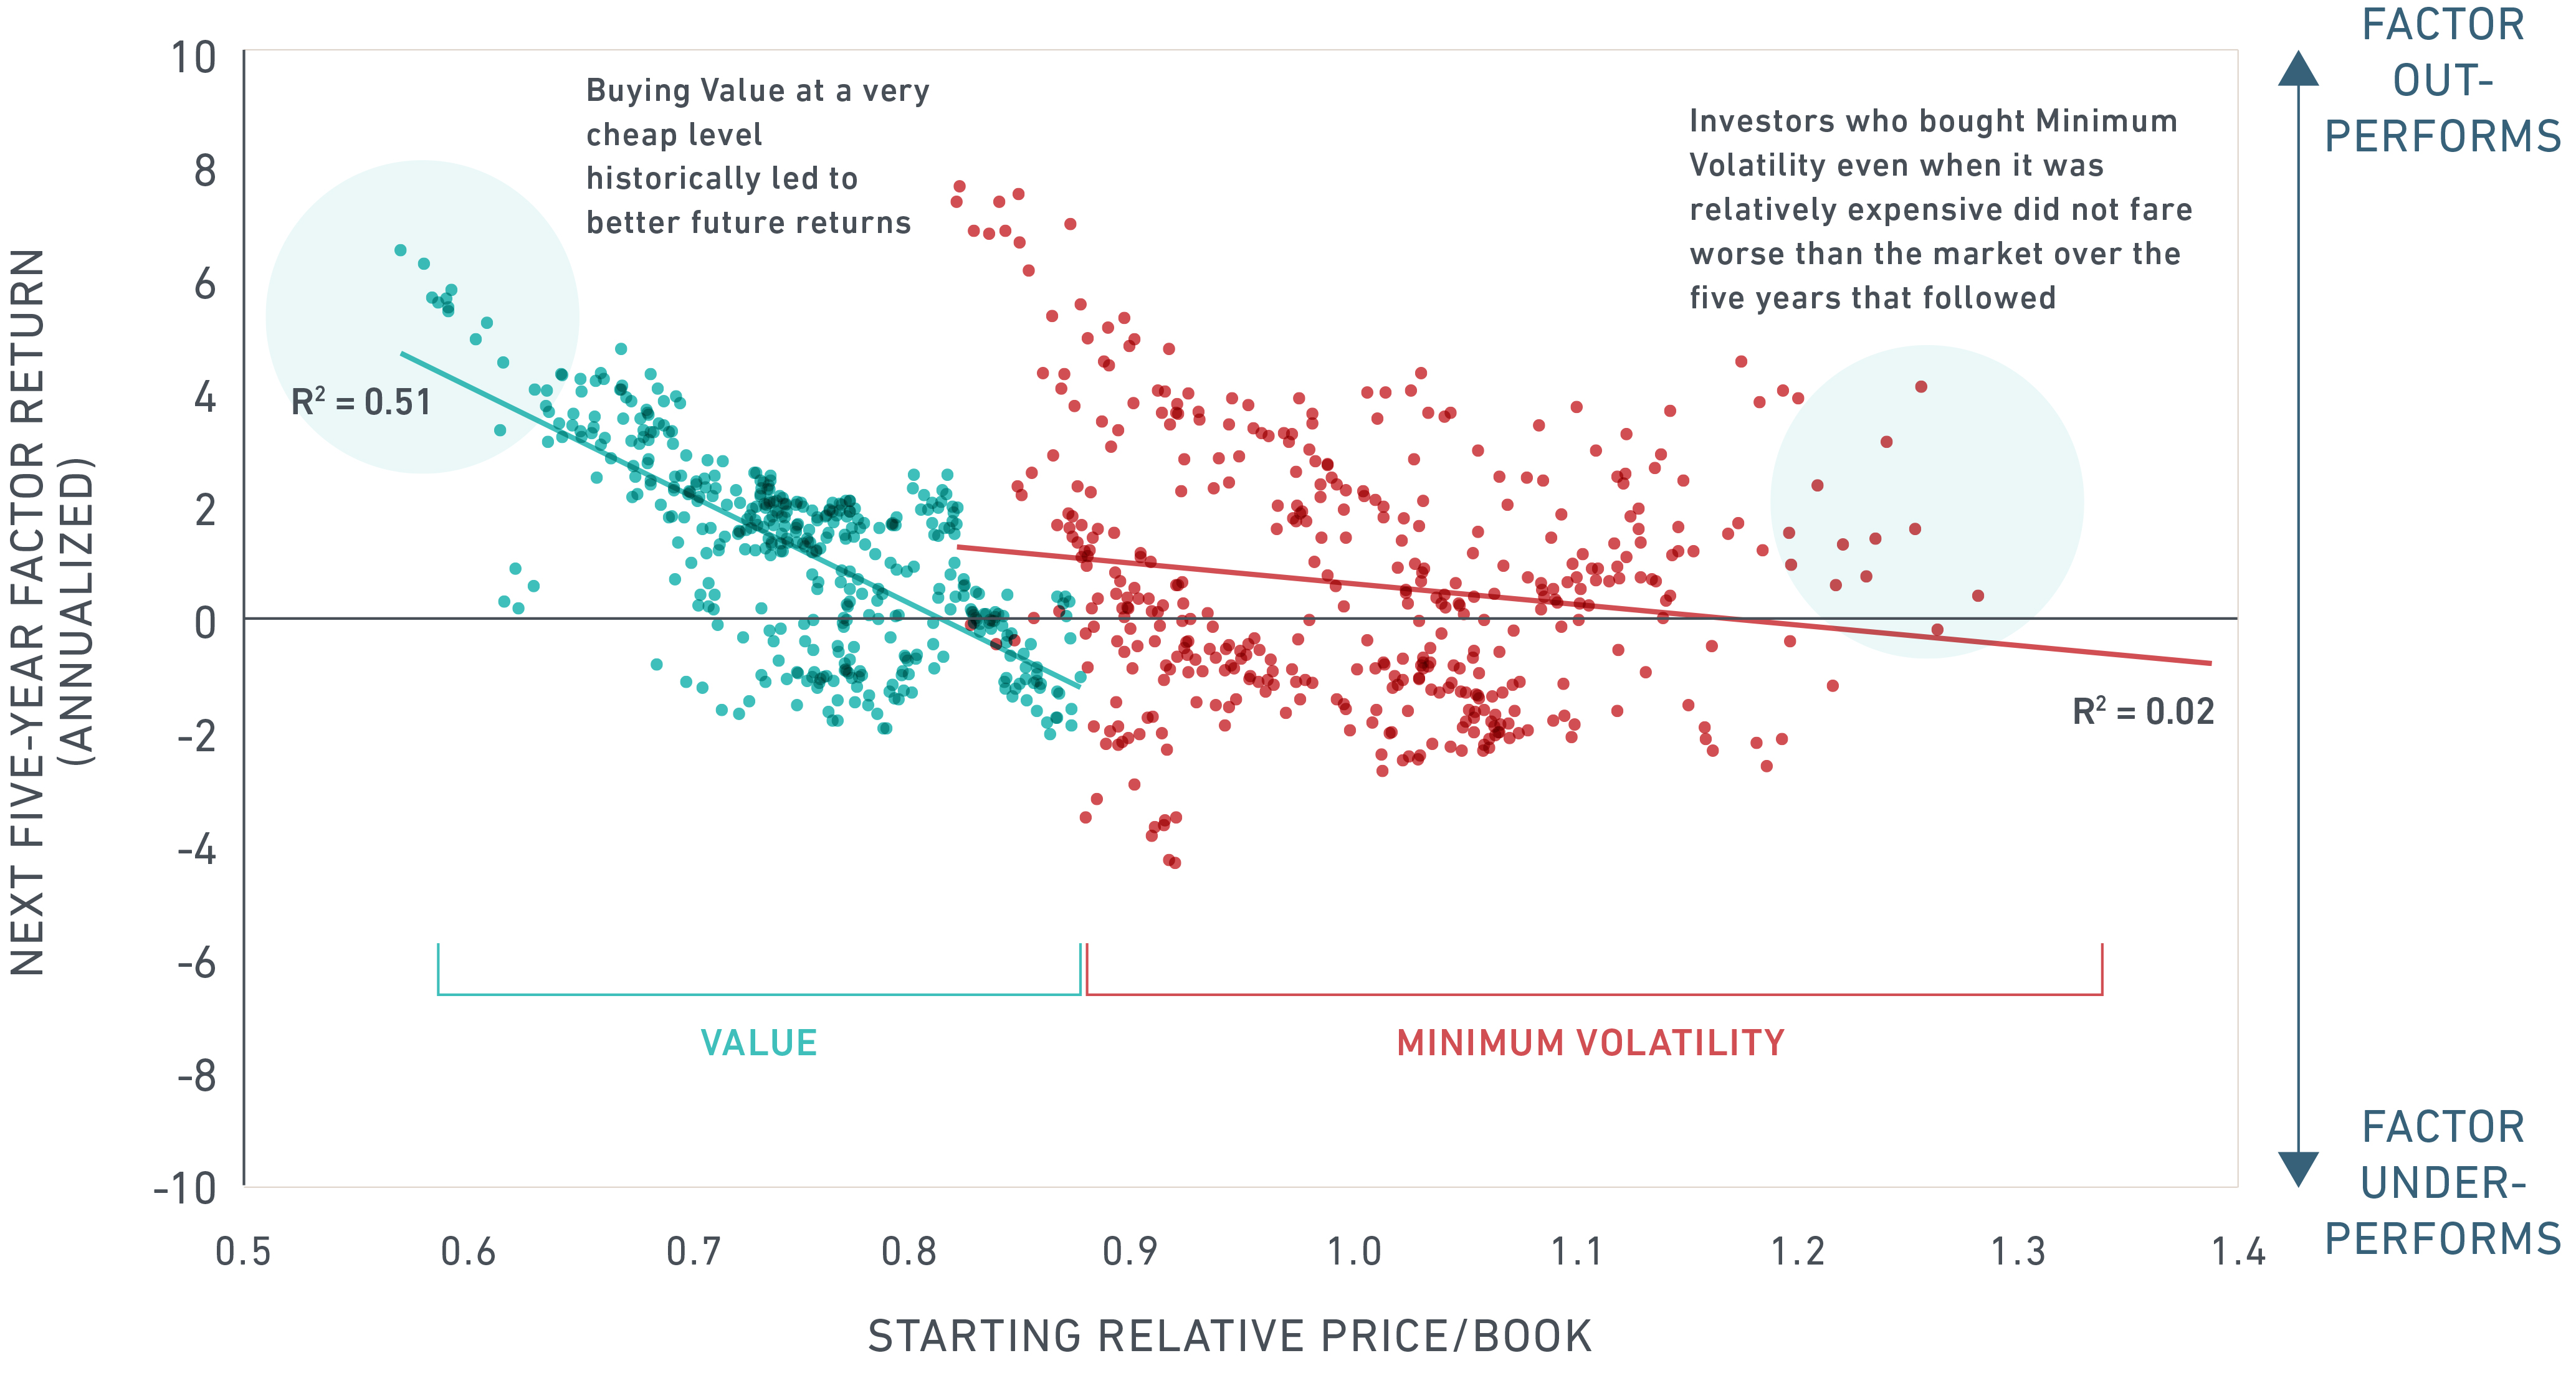
For example, the value factor appears to have an inverse relationship with valuations. Buying into value when the relative valuation levels were very low and exiting value when the relative valuations were high would have increased the probability of historical outperformance. The value index displayed a strong linear relationship fit, as explained by the R² of 0.51 for subsequent five-year returns as seen in the below exhibit. The size (equal weighted) factor displayed a broadly similar result but with a weaker statistical fit (R² of 0.22).
By contrast, there is little evidence to suggest that valuations determined the future performance of the minimum volatility index. For instance, investors who increased exposures based on a minimum volatility index during periods of relatively richer valuation did not fare worse than the market over the five-year periods that followed. As we can see in the exhibit, the relationship between the minimum volatility index and future performance was not strong (R² of only 0.02).
Correlations between valuations and future factor returns against market (value and minimum volatility)

Source: MSCI Research, based on five-year periods from Nov 1975 to June 2016. Prior to May 31, 1988, we simulated the history of the MSCI Minimum Volatility indexes by selecting the top 300 stocks by lowest three-year weekly variance from the MSCI World Index, then weighting the stocks in inverse proportion by market capitalization.
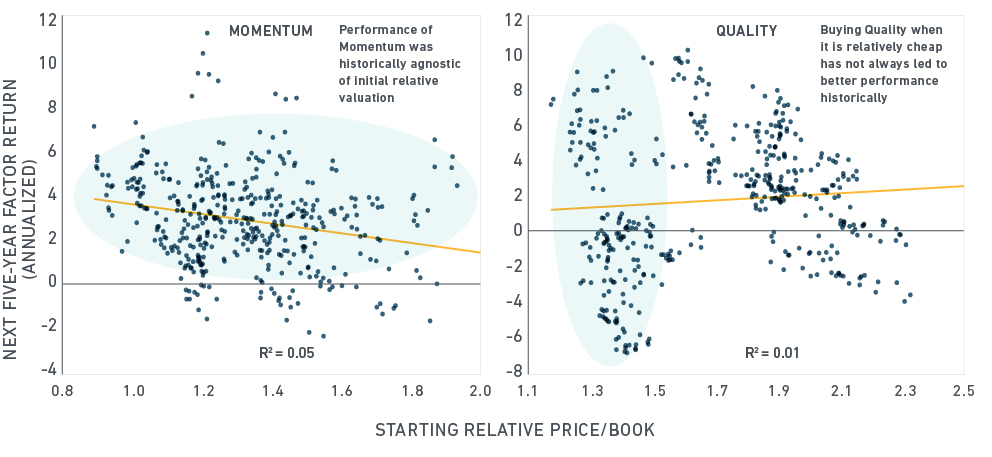
Our analysis of the momentum, quality and dividend yield factors leads to a roughly similar conclusion. As the charts below suggest, timing either factor based on valuations was unlikely to produce consistent superior returns.¹ For both sets of indexes, the findings held whether we used price-to-book ratio as an indicator of valuation or combined price-to-book, price-to-earnings, price-to-cash flow and dividend yield.
Correlations between valuation and future factor return against market (Momentum and Quality)

Source: MSCI Research, based on five-year periods from Nov 1975 to June 2016.
What can we infer from the analysis?
First, inherent characteristics of factors themselves have led to biases in valuation. Value, by definition, trades at a discount to the market, while quality, minimum volatility and momentum all tended to trade at a premium.
Second, an extremely low relative valuation might have historically helped explain the future performance of the value factor (and the yield factor to a certain degree). Intuitively, this makes sense. Investors need a valuation reference point to evaluate the premium they would receive as a result of taking on the added risk from those factors.
In contrast, valuations for the minimum volatility, momentum and quality factors have shown a weak relationship with subsequent performance. In general, investors have pursued strategies based on these factors because of inefficiencies resulting from behavioral biases than from relative valuation. Trying to use valuations to time those factors, at least historically, would have been a difficult exercise.
Third, using relative valuations to time an investment strategy would require both skill and an assumption that factors will always revert to a mean valuation within a specific time horizon. This is a tricky assumption to start with, as the composition of the factor indexes can differ significantly over time. As our previous research has shown, diversifying across factors historically has mitigated the risk of ups and downs in single factor performance in the absence of such skill and without perfect information.
¹ Though not depicted in the charts, the dividend yield factor had an R² of 0.09.
Further reading:
Brexit shows (again) the benefits of minimum volatility
How smart beta has performed amid the volatility
Seeking defensive yield in emerging markets and Asia
Multi-factor strategies highlight benefits of diversifications
