- Several Australian pension funds recently announced an out-of-cycle valuation adjustment to their real estate portfolios, writing down asset values by up to 10%.
- We extrapolated what this information could mean for Australian real estate yields under different income-growth scenarios and compared the results to past corrections.
- A 10% write-down in our scenarios could indicate that asset values return to levels last seen in late 2017, but imply a relatively modest increase in yields compared to the global financial crisis or the early 1990s recession.
As the COVID-19 pandemic continues to take its human toll and disrupt global economies, real estate investors have been seeking to understand what impact the crisis could have on their portfolios. Recently, several large Australian pension funds took the decision to do an out-of-cycle valuation write-down on their portfolios of up to 10%.1 Using the Property Council of Australia/MSCI Australia Annual Property Index, we can investigate how a 10% write-down compares to past asset-value declines and what that might imply for yields under different scenarios for net-operating-income (NOI) growth.
Putting the 10% in historical context
The Property Council of Australia/MSCI Australia Annual Property Index dates back more than 30 years, to December 1984 — yet there have been only two periods in which overall asset values declined during that time. The first was in the early 1990s, when an economic recession and over-supply caused asset values to fall 32% (between December 1989 and September 1993). The second was during the 2008 global financial crisis, when asset values declined 13% (between March 2008 and December 2009).
During the early 1990s, we estimate that declines in NOI contributed approximately -6% to the fall in asset values, while repricing — as measured by increases in NOI yield — contributed approximately -27%. During the financial crisis, Australia’s overall economy was insulated from the worst effects by a natural-resources boom, which helped maintain GDP growth. As a result, NOI growth remained positive through the crisis, and we estimate that it provided a positive 5% contribution to asset-value growth in real estate portfolios. However, the disruption in financial markets saw NOI yield expand from 6.0% to 7.2%, contributing an estimated -17% to asset-value growth.
Comparison of past corrections
|
1990s |
2008 FINANCIAL |
|
|---|---|---|
| Asset Value Growth | -32% | -13% |
| NOI Yield Impact | -27% | -17% |
| NOI Growth | -6% | 5% |
| Start NOI yield | 6.1% | 6.0% |
| End NOI yield | 8.4% | 7.2% |
In the context of these two past corrections, a 10% write-down is more comparable to what was observed in the late 2000s; and if a 10% write-down were applied to the overall Property Council of Australia/MSCI Australia Annual Property Index, our models indicate that under the same parameters, values would return to levels last seen in late 2017.
How would a 10% write-down affect yields in this model?
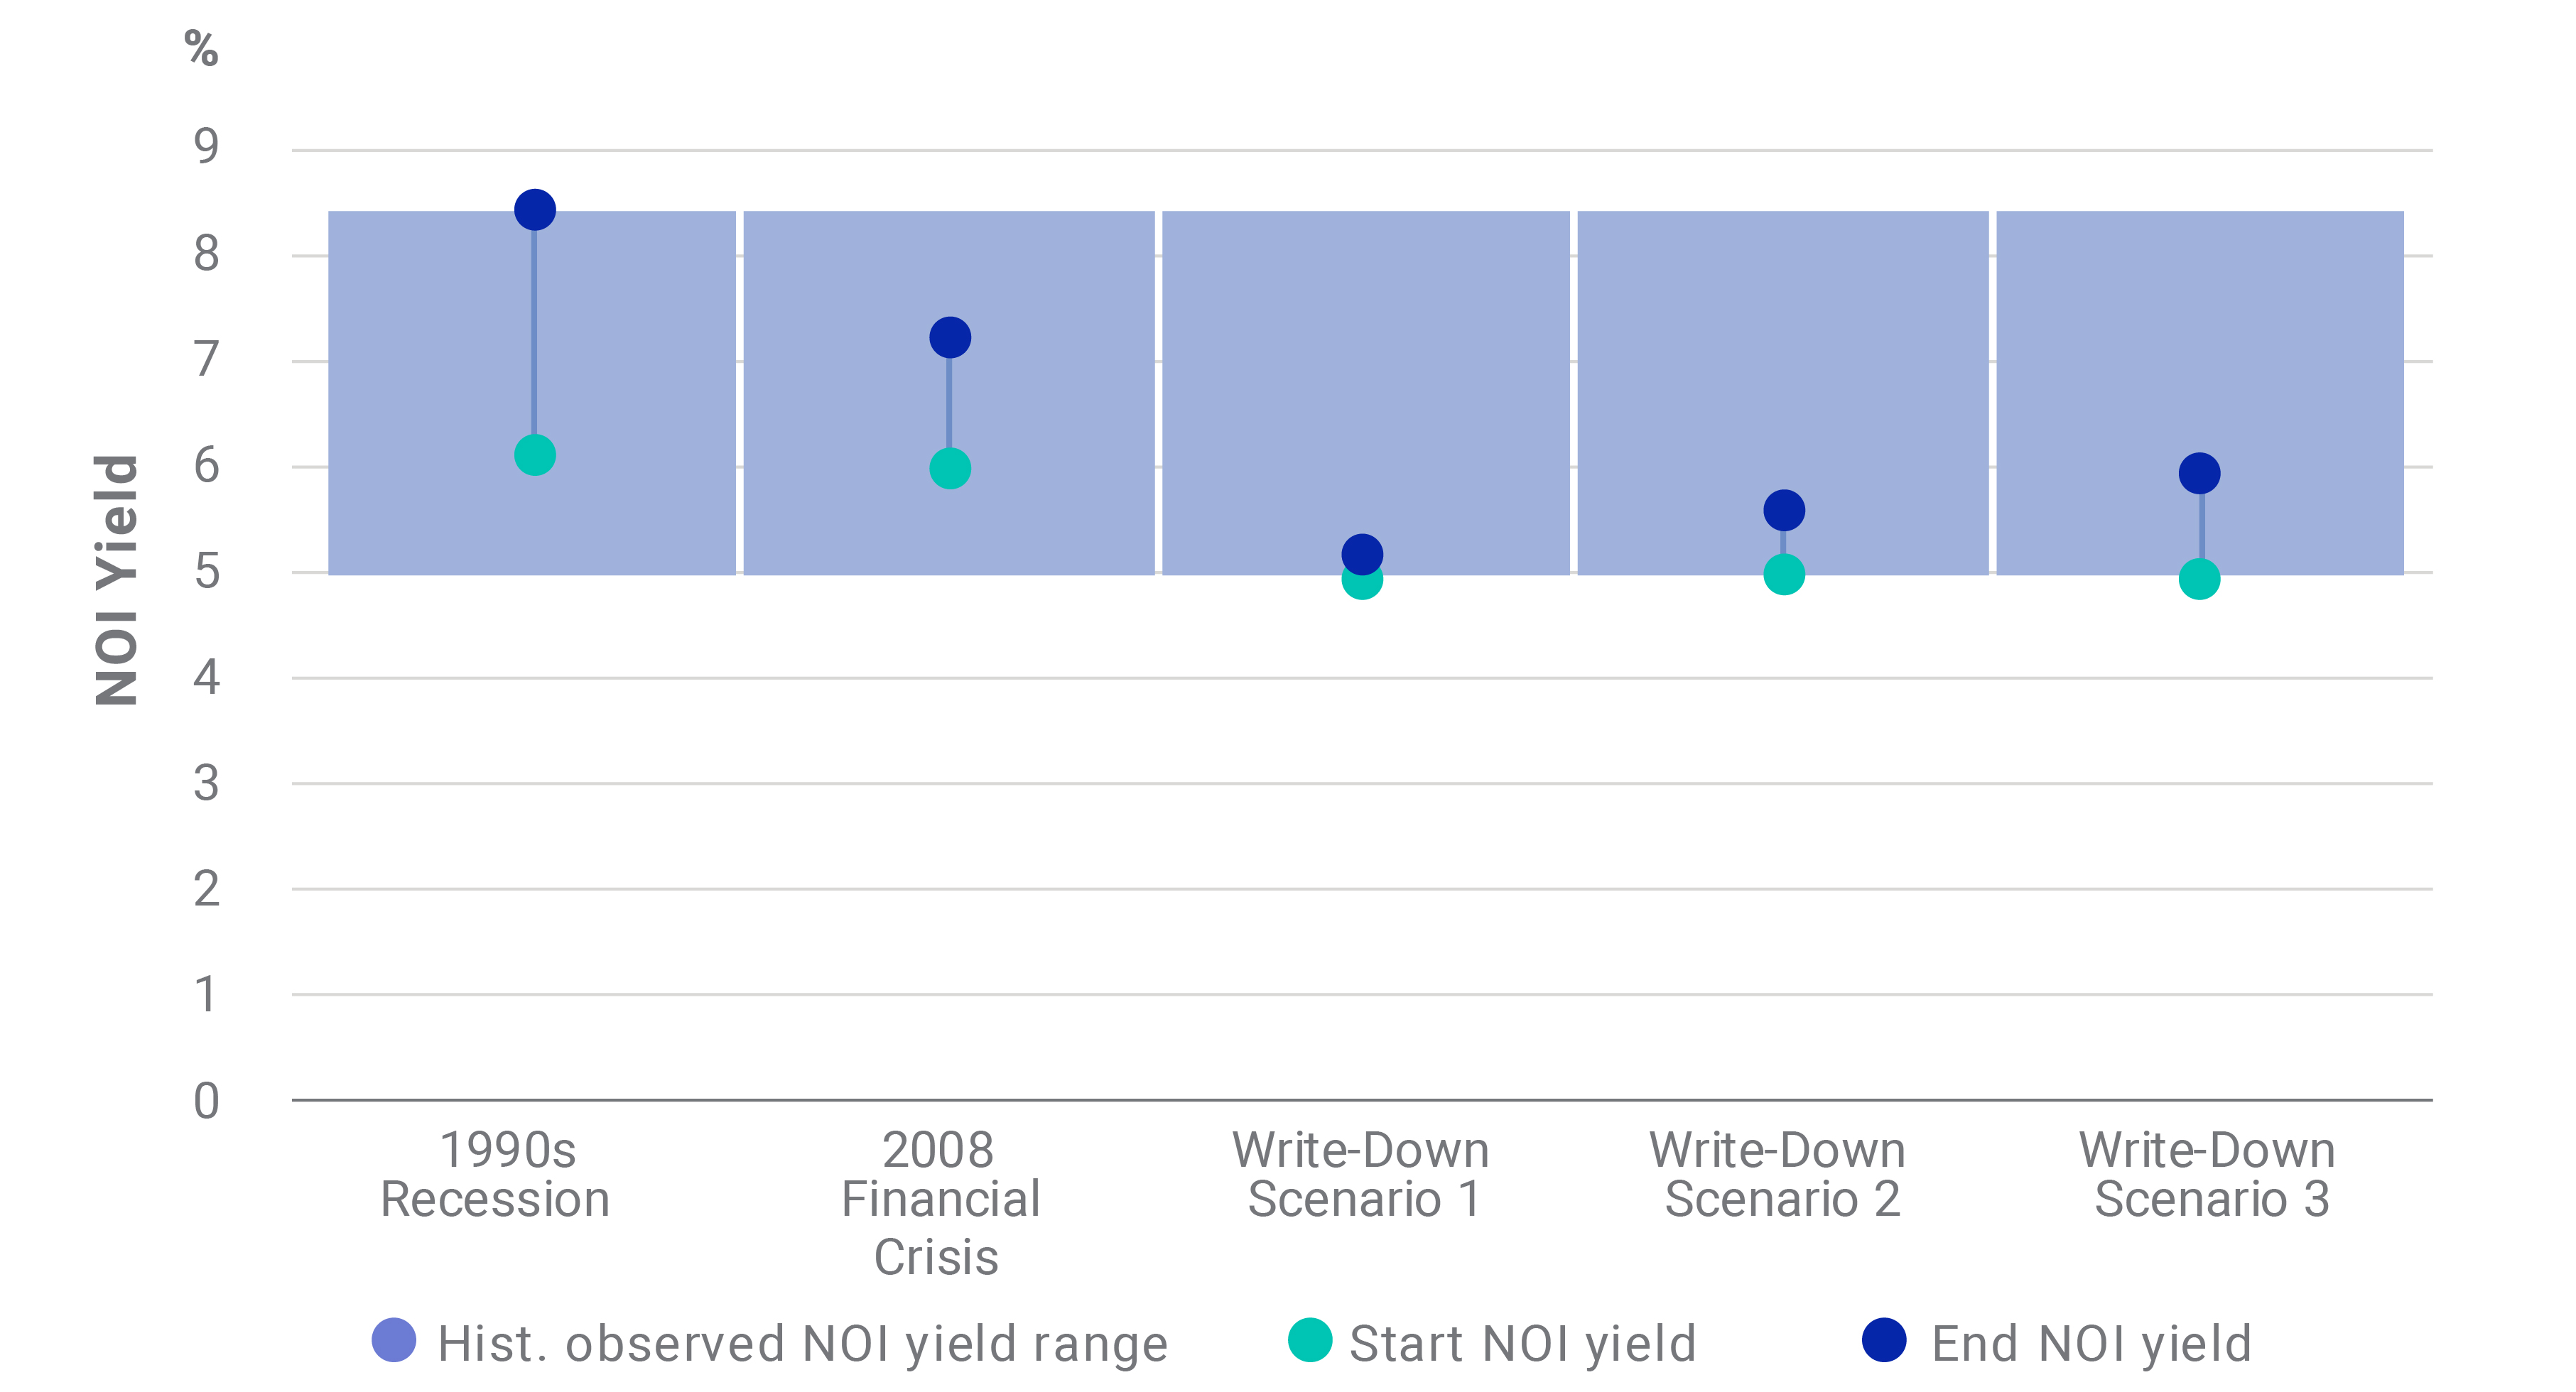
If we assume a 10% reduction in asset values, we can see what that could imply for NOI yields under different scenarios for NOI growth. In December 2019, NOI yields reached a record low of 5.0%, so a 10% reduction in asset values would imply an approximately 60-basis-point (bp) increase in yield, assuming no NOI growth under the same conditions. If, at the same time, NOI were to fall by 6% (as happened in the early 1990s), the implied increase in NOI yield would only be approximately 20 bps. But if NOI growth remains positive and grows at the same rate observed during the financial crisis, our test implied an increase in NOI yield of approximately 90 bps.
Past corrections against different 10% write-down scenarios
|
1990s |
2008 FINANCIAL |
WRITE-DOWN |
WRITE-DOWN |
WRITE-DOWN |
|
|---|---|---|---|---|---|
| Asset Value Growth | -32% | -13% | -10% | -10% | -10% |
| NOI Yield Impact | -27% | -17% | -4% | -10% | -15% |
| NOI Growth | -6% | 5% | -6% | 0% | 5% |
| Start NOI yield | 6.1% | 6.0% | 5.0% | 5.0% | 5.0% |
| End NOI yield | 8.4% | 7.2% | 5.2% | 5.6% | 5.9% |
| Yield increase (bps) | 230 | 120 | 20 | 60 | 90 |
| Yield increase (%) | 38% | 20% | 4% | 12% | 18% |
In all three test scenarios, NOI yields remain below 6% — still lower than before the financial crisis. Further, the increase in NOI yield, in absolute as well as proportional terms, remains lower than in past corrections.
Visualizing yield movements

The full impact of COVID-19 on real estate portfolios will take time to understand
As uncertainty over COVID-19 looms over global markets, we can’t determine what the full implications for real estate markets will be. We used historical data and scenario analysis to test different possible outcomes — and potentially gain a better sense of real estate portfolios’ sensitivities and risks. Understanding what changes in NOI growth or yield could imply for asset values, or vice versa, may help investors gain a clearer picture of the times ahead.
1Mather, J. “Super funds slash the value of unlisted assets in 'unique' times.” Australian Financial Review, March 24, 2020.
Further Reading
What’s the downside in real estate?
What’s driven capital growth in real estate portfolios?
Real estate is about more than location during uncertain times
