
- The MSCI ACWI Index was down 18% in 2022. The new year starts with the prospect of lower global economic growth, softening inflation and continued monetary tightening.
- Considering secular shifts in market dynamics, we highlight how some investors have looked to factors, country allocation, climate overlays and thematic investing as they seek to capture medium- or long-term opportunities with greater precision.
- MSCI’s Adaptive Multi-Factor Allocation Model pointed to momentum and value being overweight as of Dec. 31, 2022.
Investors appeared to be “caught between a rock and a hard place” in 2022, with both global equities and bonds declining against a surge in inflation, waning economic growth, geopolitical tensions and monetary tightening. The developed markets (MSCI World Index) were down 17.7% for the year. Emerging markets (EM) declined 19.7%; EM Latin America delivered strong returns (+9.5%), largely due to a 14.6% gain in Brazil (high commodity exposure and currency strength), whereas EM Asia lagged (-20.8%) due to weakness in China (-21.8%), Taiwan (-29.1%) and Korea (-28.9%).
The International Monetary Fund (IMF) has forecast lower global economic growth over the next few years, with regional variations. In terms of contributions to global growth, the Organization for Economic Cooperation and Development (OECD) forecasts EM Asia to take a larger share in 2023, led by India and China, whereas North America and Europe are expected to take a smaller share (see below). And has inflation peaked? The OECD projects softer inflation for developed markets over the next two years (see right below).
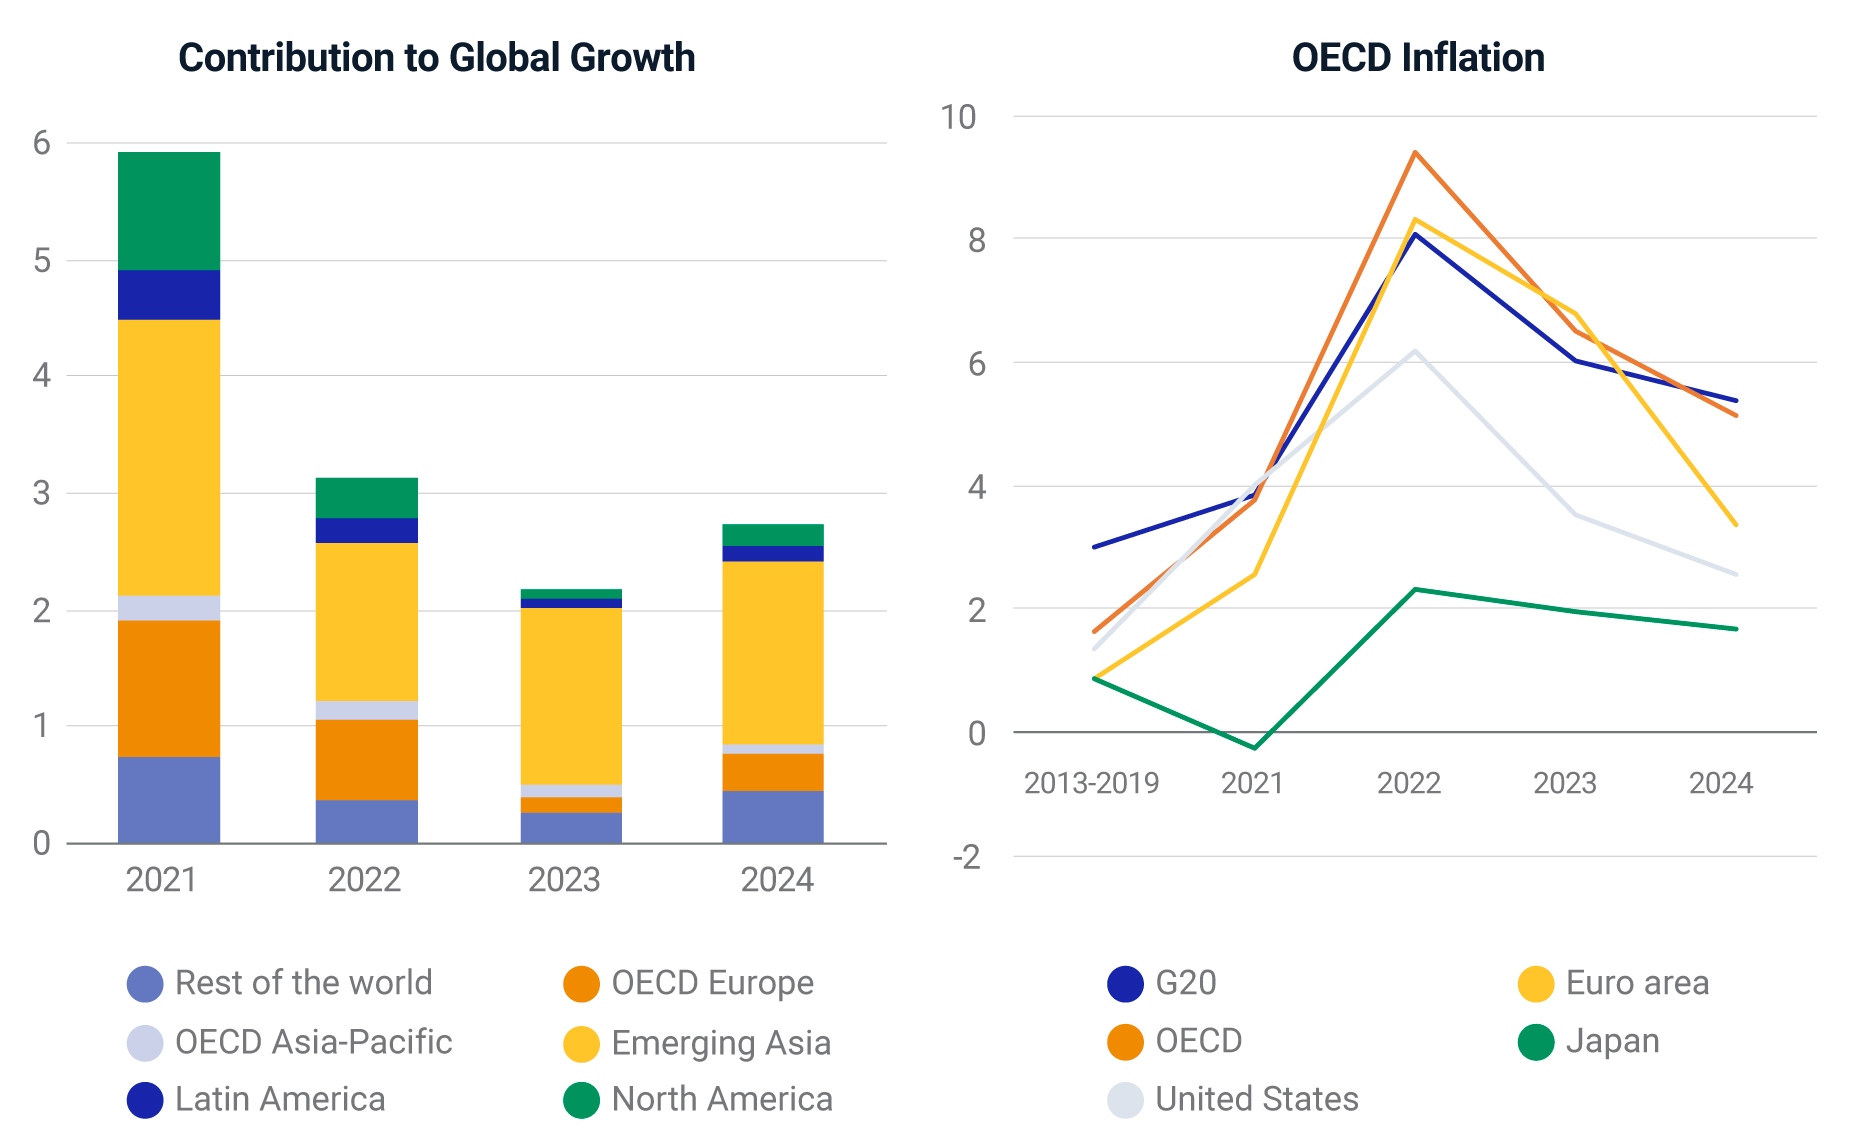
Source: OECD Economic Outlook. November 2022.
The impact of major central banks raising interest rates to combat inflation has led to the highest corporate borrowing costs since the 2008 global financial crisis (see below). Greater borrowing costs could weigh on corporate earnings, particularly for those companies that are highly leveraged.
Corporate bond investment-grade yield at decade highs
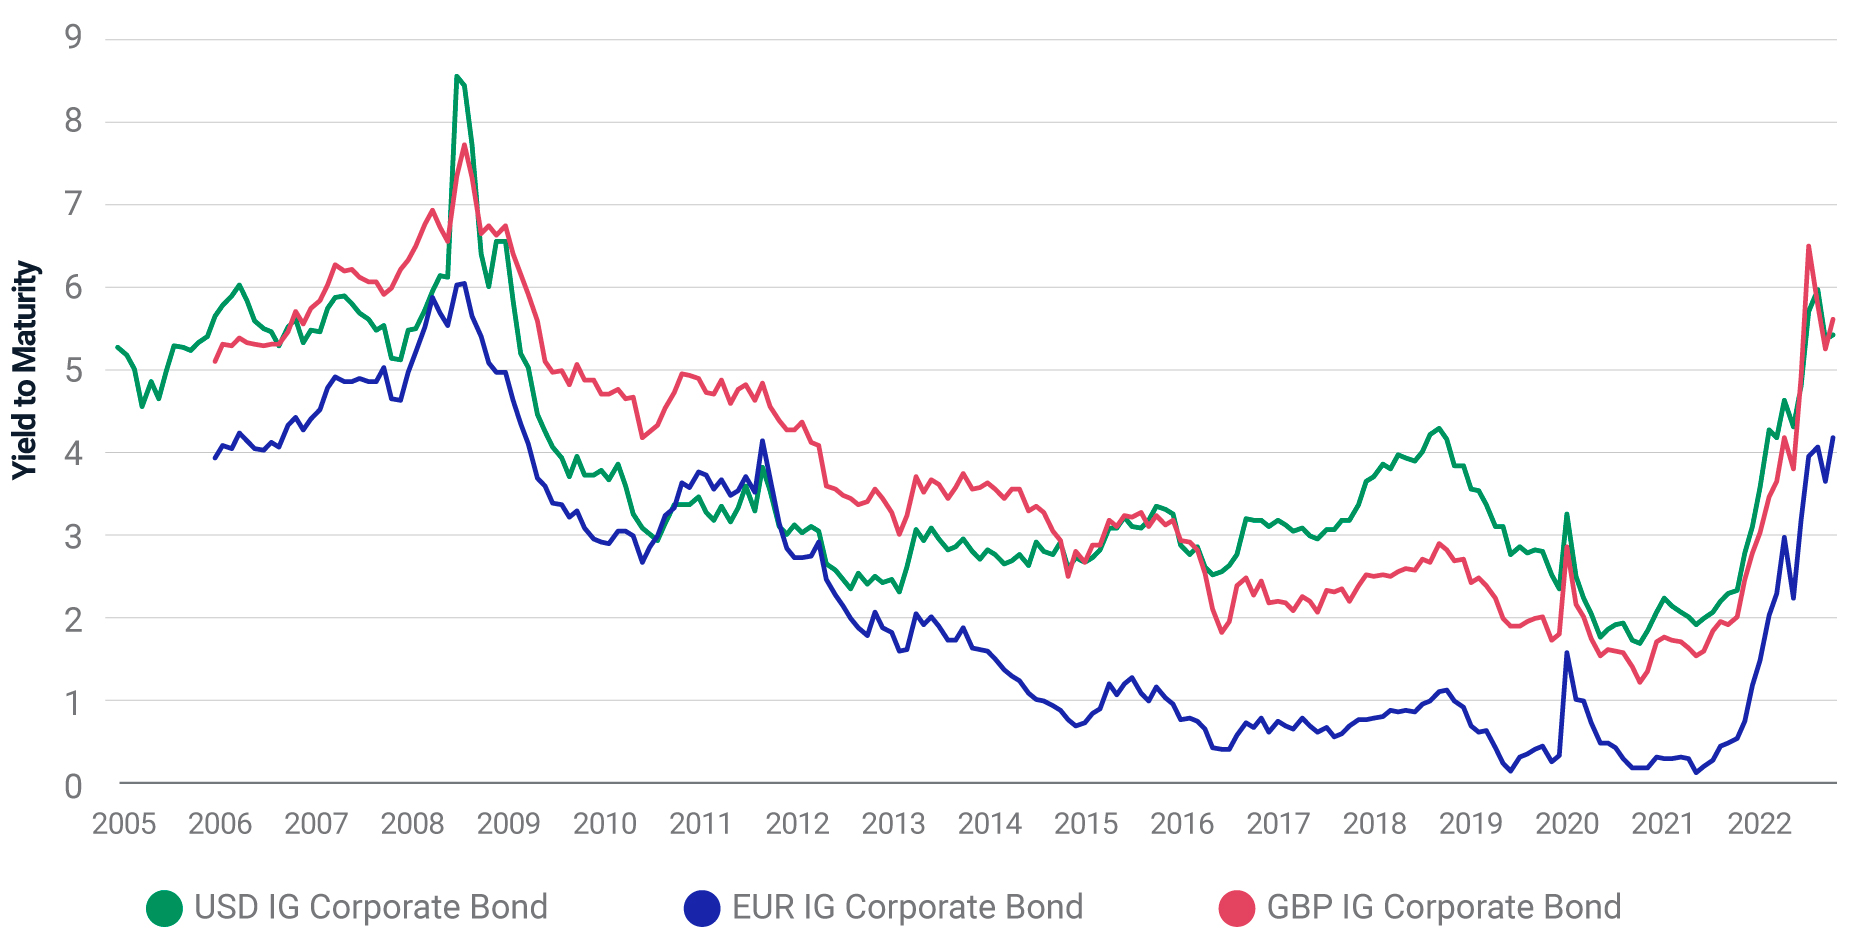
The chart shows the yield-to-maturity of the MSCI USD IG Corporate Bond Index, MSCI EUR IG Corporate Bond Index and MSCI GBP IG Corporate Bond Index. From Mar. 31, 2005, to Dec. 31, 2022 (from March 31, 2006, for EUR and GBP).
Positioning in a dynamic environment
Some investors may see such significant shifts in market dynamics as opportunities to consider active allocation decisions targeting explicit exposures across various time horizons. Traditional market-capitalization indexes across regions, sectors and countries continue to serve as staple building blocks for investment products used in asset allocation. However, non-market-cap indexes that can help create products targeted to meet additional objectives such as capturing style factor exposures, integrating ESG and climate considerations or taking exposure to thematic trends, may allow investors to more precisely seek objectives reflecting their views.
- Minimum volatility has been used for defensive positioning in regions experiencing economic slowdown/recession. In our previous blog post, we looked at how minimum volatility indexes showed resilience in times of uncertainty. Minimum volatility has also delivered relatively higher risk-adjusted returns over multiple market cycles.
- Quality has historically been a resilient factor in uncertain and volatile environments. It has also been shown that high-quality firms have historically fared well during market sell-offs in the growth and value segments of the EM, U.S. and international markets. While quality underperformed in 2022 due to negative exposure to oil-related industries as well as positive exposure to software and services, it has also been considered as more resilient in deglobalization scenarios.
- High dividend yield (HDY): While corporate earnings have historically scale back in a recession, dividends have historically been more resilient during shallow downturns (see below). HDY has delivered positive active returns (on average) during periods of stagflation. 2022 was no exception, with HDY leading factor index performance across regions alongside minimum volatility.
MSCI World Index earnings relative to dividend growth
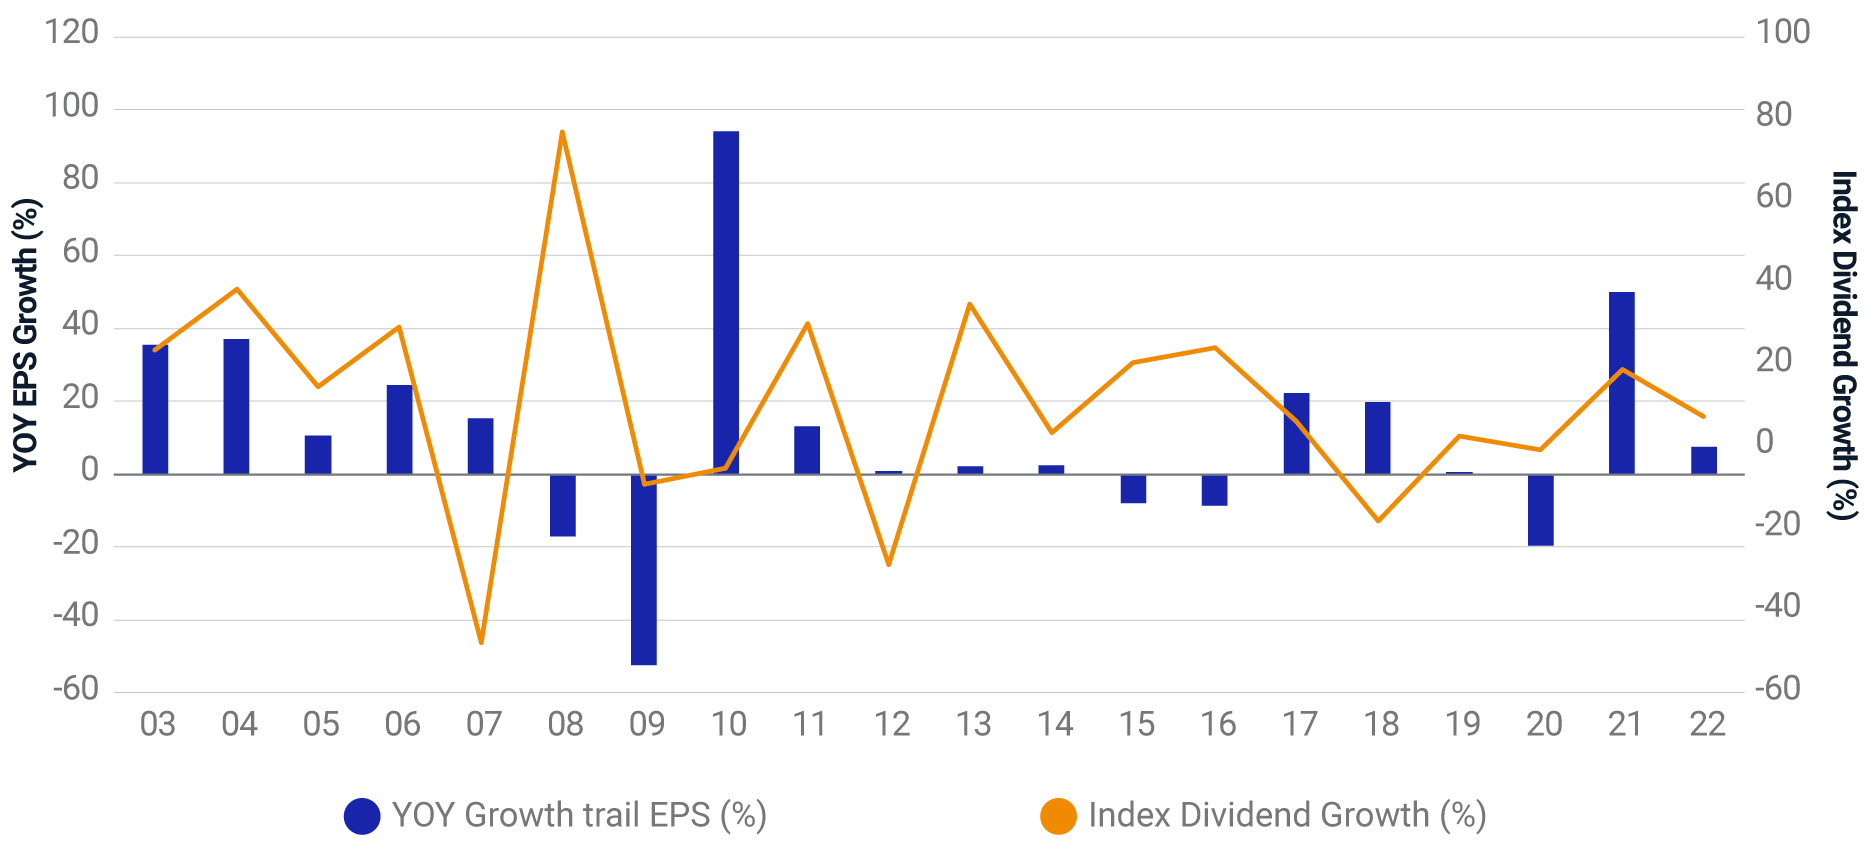
Year-on-year trailing EPS growth based on MSCI World Index. Index Dividend Growth based on year-on-year growth of the MSCI World Dividend Point Index. From Dec. 31, 2002, to Dec. 31, 2022.
- Value has generated positive active returns over extended periods of time, as witnessed from 1997 to 2010, with the decade between 2010 and 2020 puzzling both academics and practitioners. However, above-average inflation and higher interest rates may continue to favor "shorter duration" assets and hence value.
- Country allocation: Some investors may take a more active approach to capturing single-country opportunities in 2023. The IMF forecasts GDP growth to be stronger in EM Asia, particularly India, Indonesia and China (as detailed above). In markets with challenging economic growth, investors may consider a defensive stance with single country minimum volatility and/or quality strategies.
GDP Outlook
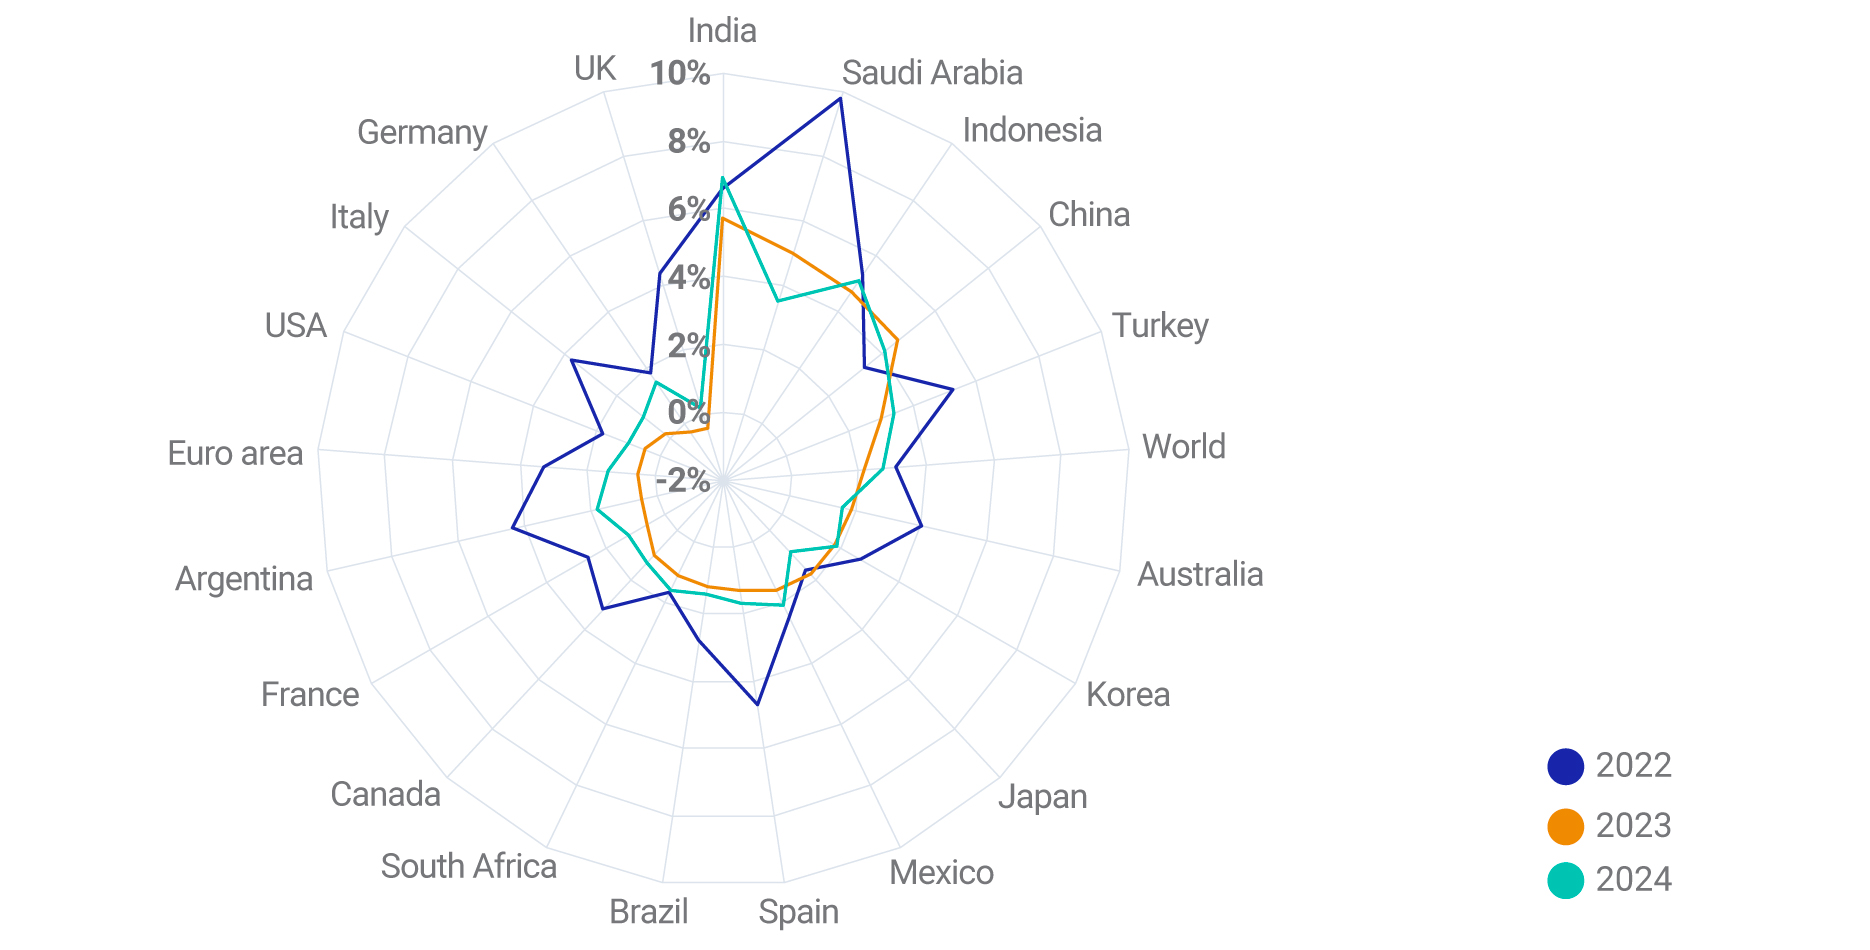
Source: OECD Economic Outlook (November 2022). Plot shows the OECD GDP growth rate forecasts for 2022, 2023 and 2024. Countries are sorted by GDP growth rates for 2023.
- Thematic investing. Despite challenges to global economic growth, investors looking to allocate towards secular trends may look to identify specific opportunities through thematic investing. Thematic investing is characterized as a top-down investment approach that seeks to capitalize on opportunities created by macroeconomic, geopolitical and technological trends. These are not considered to be short-term swings, but long-term, structural, transformative shifts.
- ESG and Climate. The MSCI Climate Risk Center has shown the increasingly significant threat climate change poses to the long-term resilience of investment portfolios. Institutional investors are looking to address climate change across their asset allocation, be it with an overlay to broad-markets, specific countries or factor.
2022 review: Investors looked for value in a challenging market
In 2022, yield and value were the best-performing factor indexes across many regions. Looking at the MSCI ACWI Index, yield and value added 11.2% and 5.6% active return respectively. In a year marked by heightened volatility, the MSCI Minimum Volatility Index reduced the risk of the parent from 21.1% to 14.3%, while adding 6.5% of active return. Climate and ESG were mostly negative-to-flat across all regions as an underweight to oil-related industries and negative value exposure weighed on their performance. Thematic indexes were mixed with indexes related efficient energy and an ageing society producing strong relative performance to the MSCI ACWI IMI Index.
Yield favored amidst a potential earnings recession
The table shows the performance of indexes from various categories, regions and countries. The bar chart shows the active returns of the same indexes, by region/country, for each month in the quarter, as well as for the full quarter. Dec. 31, 2021, to Dec. 31, 2022.
MSCI Adaptive Multi-Factor Allocation Model
Our adaptive multi-factor framework is a model designed to analyze factor-based decisions. Our research shows that and may suggest the value in taking a holistic approach to factor assessment. This approach encompasses not only the macroeconomic environment as shown above, but factor valuations, recent performance trends and risk sentiment.
As of Dec. 31, 2022, our Adaptive Multi-Factor Allocation Model showed the following exposures across the four pillars:
- Macro Cycle: Overweighted quality, low volatility and momentum with signals from the Chicago Fed National Activity Index, Federal Reserve Bank of Philadelphia’s ADS Index and PMI being mixed.
- Valuation: Overweighted value, momentum and low size based on the valuation gap compared to an equal-weighted factor mix in the context of nearly 30 years of a factor’s history.
- Momentum: Selected momentum, value and yield based on relative performance over the last three months.
- Market Sentiment: Showed a slight overweight to low size, value and momentum with mixed signals from VIX and credit spreads.
At the end of 2022, the MSCI Adaptive Multi-Factor Allocation Model showed an overweight to momentum, with value also being a slight overweight, relative to an equally weighted factor mix (as shown below).
Exposures from MSCI’s Adaptive Multi-Factor Allocation Model
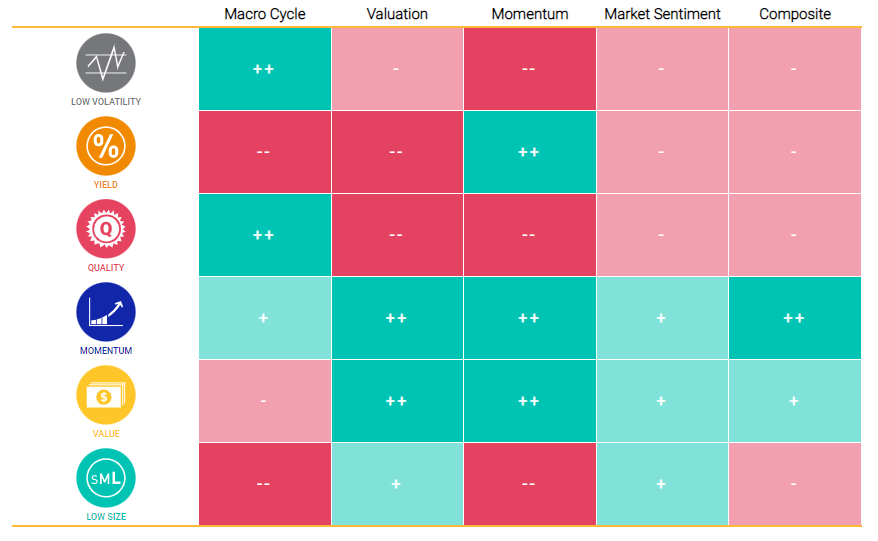
As of Dec. 31, 2022. Positive exposures are denoted as + or ++, negative as - or -- and neutral as N.
Further Reading
Markets in Focus: Is the Beta Pendulum an Edge or Hedge?
Factors in Focus: Disentangling Market Gyrations Through the War
Factors in Focus: Are Your Equity Styles Ahead of the Curve?
Factors in Focus: Impact of Inflation on Style Factors
