Fundamental equity managers have traditionally looked for an edge using various strategies and approaches. Here we examine whether it historically has been possible to manage a fund’s risk exposures without disturbing the underlying investment process.
At its most basic level, a manager’s investment process typically consists of two steps: stock selection and portfolio construction. In a recent blog post on how active managers can integrate environmental, social and governance (ESG) criteria into their portfolios, we demonstrated how this data could be used to refine the stock-selection process. In this new post, we explore portfolio construction. Specifically, we examine how reweighting stocks can be combined with traditional stock selection.
THE DETAIL
We use the MSCI Factor Classification Standard (FaCS), which provides a framework for evaluating, implementing and reporting style factors in hypothetical equity portfolios. Our setup has two components. First, we start with a sample of mutual funds, taken from the MSCI Peer Analytics universe. Next, we modify the weightings of stocks in the funds to tilt towards a particular FaCS exposure. We then impose a constraint to reweight stocks which the fund currently holds – no new stocks are added. This preserves the portfolio manager’s stock selection. We use optimization to reweight stocks.
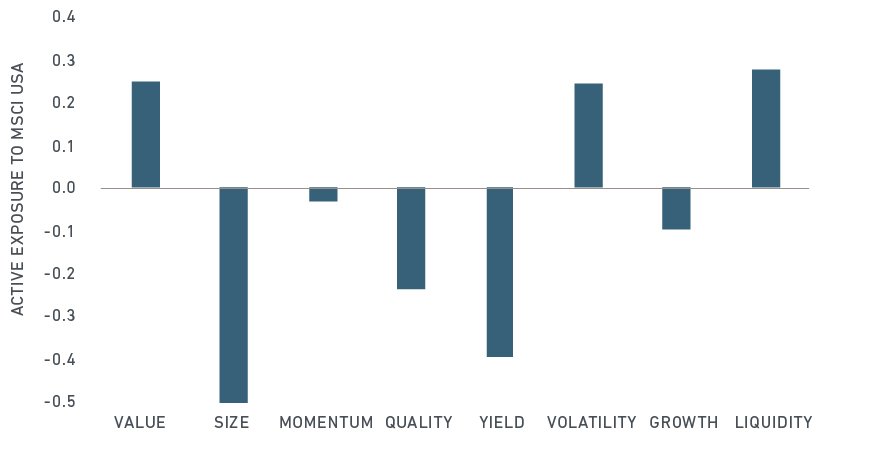
In this analysis, we start with a cohort of U.S. small-cap value funds, and modify each individually. Small-cap funds are a good starting point, as MSCI research has shown that these stocks historically had other characteristics that previously detracted from returns. Two of these characteristics are relatively low quality and higher volatility, compared to larger stocks. Indeed, our small-cap value managers exhibited these same biases, as shown below.
FACTOR BIASES CAN IMPACT SMALL-CAP VALUE FUND PERFORMANCE

Fund universe consists of mutual funds classified by Lipper as US Small Cap Value, and which have continuous monthly holdings from January 2008 to March 2018. Twenty-nine funds met these criteria. The vertical axis is capped; size exposure is -2.5.
We then run two similar experiments on each fund. In the first, we target a FaCS Quality exposure 0.20 higher than the original fund. In the second, we target a FaCS Volatility exposure of 0.20 lower than the original fund. We then measure both the active return and active risk between the original and modified fund for the period from January 2008 to March 2018. For this exercise, we set 150 basis points (bps) of active risk between the modified and the original fund as a threshold that we, ideally, aim to stay below.
HOW SUCCESSFUL WERE THE EXPERIMENTS?
The results were both promising, and mixed, as a result of us modifying each fund’s quality and volatility exposures.
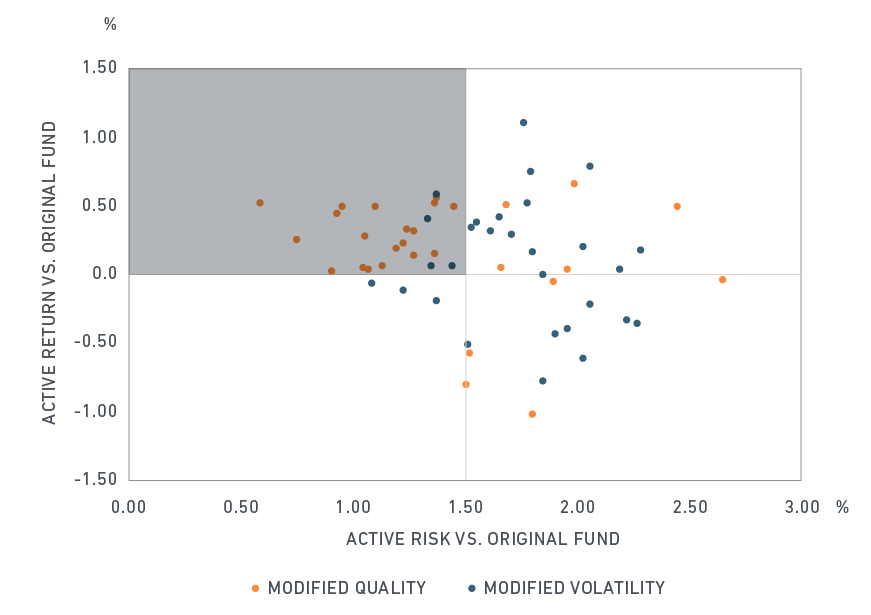
When we modified quality, we observed that returns rose in a large majority of our funds, shown in the orange circles below where each circle represents a fund’s results. Moreover, returns improved while keeping active risk below 150 bps in most funds. In contrast, we were less successful in modifying volatility. In only four of the 29 funds did returns improve, while active risk was kept below the threshold.
For funds where returns did improve, on average this increase was by 30 and 37 bps annually, with 131 and 173 bps in active risk, in the quality and volatility experiments, respectively. For those funds where returns improved and where we were able to stay below the active risk threshold, the uplift was by 29 and 26 bps annually, with 113 and 138 bps in active risk, in the quality and volatility experiments, respectively.
The effects of modifying quality and volatility

Each circle represents result of a backtest. MSCI’s Barra Portfolio Manager is used to backtest each fund quarterly, from January 2008 to March 2018. Factor targeting is implemented via optimization with a quadratic penalty function. Note that backtested results may differ from actual results and that past performance, backtested or actual, is not indicative of future results.
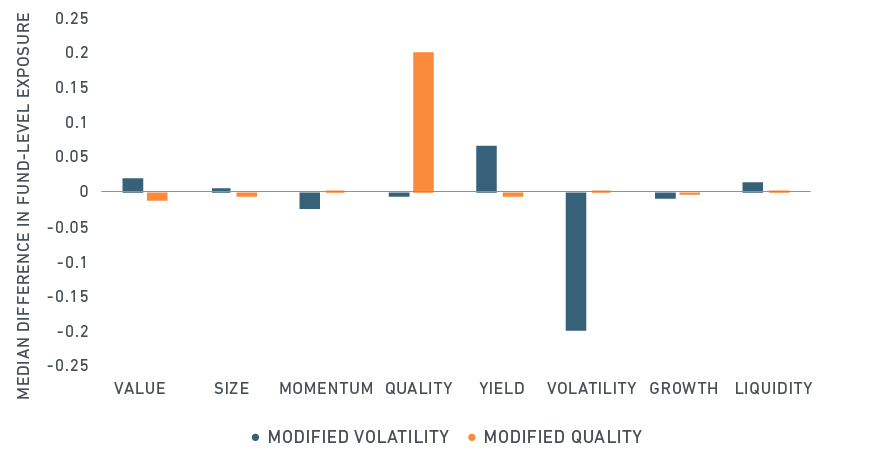
Importantly, we did not introduce any new, unintended factor tilts. At the outset of this post, we noted that we wanted to preserve the manager’s stock-specific views, and their investment style (small-cap value). We show how successful we were in the final exhibit, where we show the average difference in exposure for each factor.
Given how our experiment was set up, it’s not surprising that the difference in quality and volatility factor exposures were 0.20 and -0.20, respectively. Significantly, we were able to increase the quality exposure without considerable changes to other factors.
Lowering a fund’s volatility exposure, on the other hand, resulted in a higher exposure to yield. In other words, we needed to hold more of the low risk, dividend payers in the portfolio to meet our volatility target.
What about active share? An active share of 50% or higher between two funds, for example, indicates the funds are significantly different from one another. The average active share of our modified funds compared to the original funds was 10% and 14%, respectively, for the quality and volatility experiments. In other words, modifying the funds required only a slight reweighting of stocks.
The quality and volatility tests: Were other factors affected?

Difference is calculated from monthly FaCS exposures between the modified fund and the original fund. A median value is then calculated over all funds for each backtest.
As we have demonstrated, MSCI FaCS could have been used to help these active managers differentiate themselves. In this scenario, we were more successful in modifying quality than volatility. Placing added emphasis on the volatility factor tended to increase active risk significantly. Portfolio managers targeting a lower volatility exposure may choose to balance the likelihood of outperformance with the changes to their stock selection. It is also important to note that in our experiments we did not account for fund-specific constraints, such as a turnover limitation.
Good stock selection is often at the core of a successful active equity manager’s strategy. Identifying the appropriate weighting of the stock – the portfolio construction piece of the puzzle – is often a secondary consideration. However, the right analytical toolkits can help portfolio managers balance their views with regards to their risks.
Further Reading
How can active managers put ESG to work?
