The U.S. equity market ended last year with a historic drawdown, as we noted in our blog post “Beaten-down beta.” Factor models helped us identify the pockets of the U.S. market in which losses were concentrated, and beta stood out as a driver of the market decline. But what happened when those losses starting reversing in early 2019?
Here we explore the potential value of paying attention to beta when markets gyrate. As we noted, high-beta stocks across many developed markets — and not only the well-known FAANGs1 — sold off rapidly in the fourth quarter of last year, in favor of more defensive stocks.
Reversal of fortunes
Many of the 2018 year-end losses reversed at the start of 2019: The MSCI World and MSCI Emerging Markets indexes are up 12% and 9%, respectively, from the start of January to March 1 of this year.
Below we plotted the 20 worst quarters for the beta factor as measured by the MSCI Long-Term Global Equity Model (GEMLT), along with the factor’s return the subsequent quarter. Two observations are worth highlighting.
First, for 17 of the 20 worst quarters, the beta factor had a positive return in the subsequent quarter. Just as individual stocks and sectors have reverted to the mean, factors did as well.
Second, 2019’s reversal (the eighth yellow bar) was on par with previous turnarounds.
20 worst quarters for beta factor (GEMLT)

Source: MSCI Global Long Term Equity risk model. Returns are quarterly.
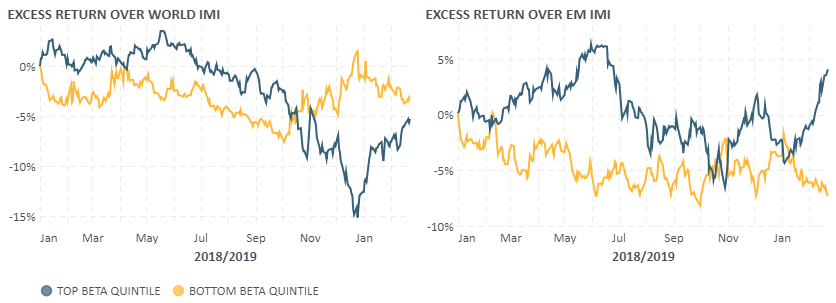
We next recreated the quintile plots from our previous blog post — but now from a global perspective. For the MSCI World Investable Market Index (representing developed markets) and the MSCI Emerging Markets Investable Market Index, we created portfolios comprised of the highest- and lowest-beta stocks in each market by quintile. We then traced each portfolio’s return from the start of 2018 to the end of February 2019.
There was a rotation in the fourth quarter in developed markets. However, there was a modest rotation in emerging markets, where the sell-off last year was more broad-based.
The beginning of 2019 has been altogether different in emerging markets, however: Investors rotated into high-beta stocks. Chinese stocks, in particular, soared, with the MSCI China and China A indexes up 16% and 26%, respectively from January through March 1.
Excess returns over developed and emerging markets

Source: MSCI Global Long Term and Emerging Markets Equity Risk Models. Quintile portfolios formed daily from the MSCI World IMI Index and MSCI Emerging Markets IMI Index based on exposure to each region’s respective beta factor.
Last, we examined sectors. The rotation into defensive sectors that started at the end of 2018 has paused. Cyclicals outperformed defensives by over 3%, from the start of January through March 1, as measured by the difference in return between the MSCI ACWI Cyclicals and Defensives indexes.
One question investors might ask is how much of the outperformance was due to industries themselves and how much was down to the market reversal.
The final plot attributes this outperformance using the GEMLT risk model. Unsurprisingly, one of the principal sources of outperformance are industries: Technology services, oil and gas explorers and aerospace firms were all large positive contributors. Consequently, technology, energy and industrials have led all other sectors thus far.
However, one surprise is that the largest driver of cyclicals’ outperformance is beta itself. Its effect was larger than all other style factors combined.
Performance Attribution of ACWI Cyclicals vs. Defensives

Return decomposition is from January 1 2019 to March 1 2019 for MSCI ACWI Cyclical Sectors and Defensive Sectors Indexes. The GEMLT model is used to attribute returns.
As we have seen over the past six months, risk-on and risk-off periods have been more nuanced than they initially appear. Tracking the beta factor can help bring focus in fast-moving markets.
1 Facebook, Apple, Amazon, Netflix and Google.
