How did different equity factors fare during the past week’s market turmoil? When markets are gyrating, it can be difficult to figure out just what is happening. Real-time data provides greater insight into market events as they unfold.
What we observed was a shift in the U.S. stock market. The market began tumbling on Friday, Feb. 2. By Monday, investors started rotating out of stocks that were more sensitive to the market (“high beta stocks”) to safer, lower volatility stocks. At the same time, volatility — as measured by the VIX — spiked. Earlier this week, we looked at how this heightened market volatility affected various sectors and factors. Now, we look at how real-time data provides deeper insights into the rotation that occurred between the minimum volatility and momentum factor indexes.
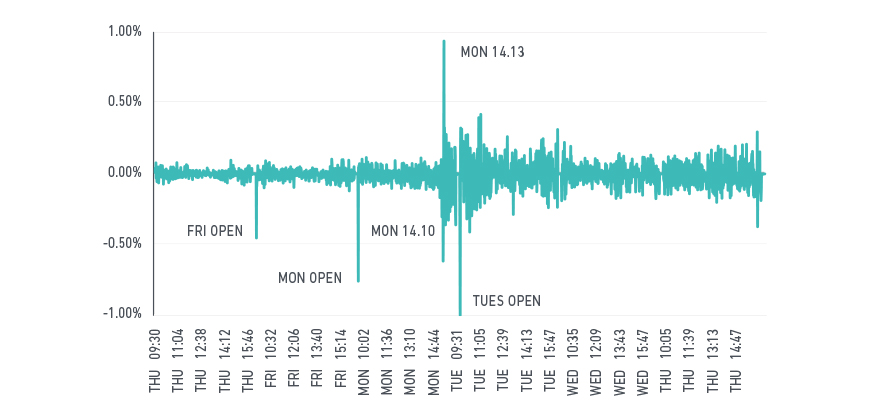
We use MSCI Real Time Indexes to analyze the data. The exhibit below traces the minute-by-minute return of the MSCI USA Index over the course of the week. Four periods stand out where returns swung sharply: the market opens of Friday, Feb. 2 and Monday, Feb. 5; the afternoon of Monday, Feb. 5, and the open of Tuesday, Feb. 6. Notably, while volatility was elevated from Tuesday through Thursday, no distinct period stood out. What conclusions can we draw into the relative performance of low volatility and momentum strategies?
Volatility spiked as markets became more turbulent
MSCI USA intra-day

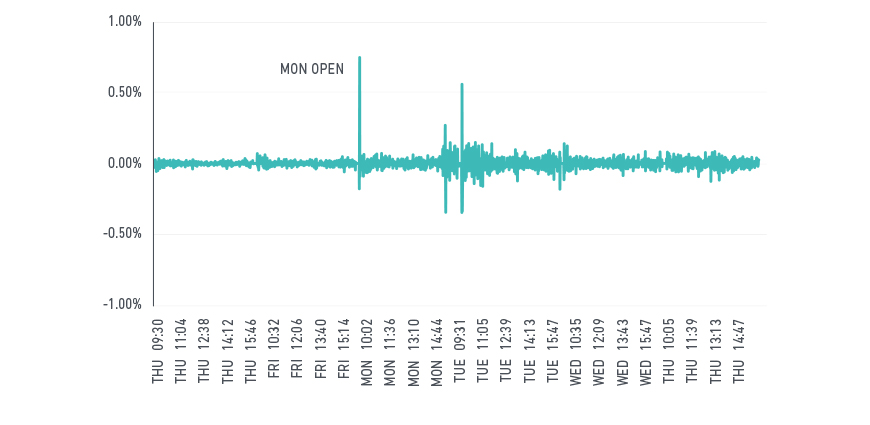
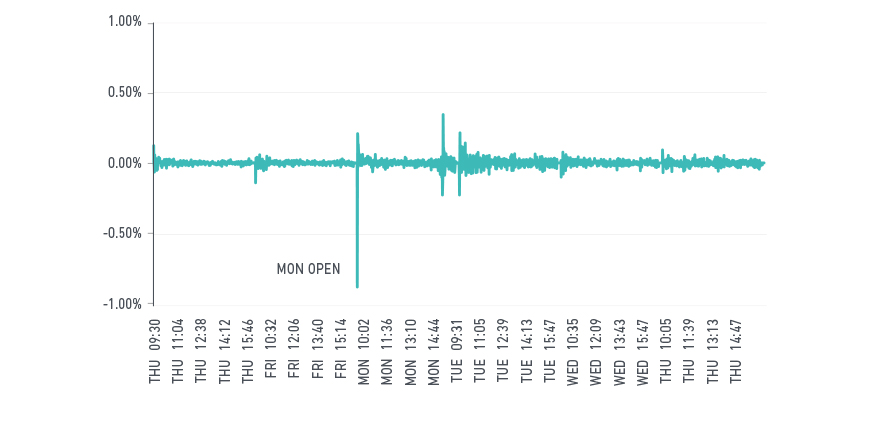
Using intra-day active returns of the MSCI USA Minimum Volatility and MSCI USA Momentum indexes, we see that factors spikes were similar to the broad market. However, there was one exception: By the market’s open on Monday, Feb. 5, a sharp sell-off in the momentum index coincided with a sharp up-tick in the minimum volatility index. Finally, while the broad market displayed elevated risk during the rest of the week, factor returns were relatively calm.
How minimum volatility and momentum performed
USA min vol intra-day active return

USA momentum intra-day active return

Why did the two factor indexes move in opposite directions last Monday? The answer may come from unintended exposures in the momentum index. As expected, the MSCI USA Minimum Volatility Index had high exposure to low volatility stocks. How about the momentum index? Unsurprisingly, the MSCI USA Momentum Index had high exposure to the FaCS[1] Momentum factor. But it also had relatively high exposure to high-beta stocks, as indicated by its negative exposure to the FaCS Low Volatility factor. The index was holding recent winners that were also relatively high beta. These secondary, unintended tilts can expose investors to risks that they do not anticipate.
FaCS factor exposures of the MSCI Momentum and Minimum Volatility indexes

We now have a clearer picture of this week’s market events. The broad market started its slide on Friday, Feb. 2. Investors subsequently began rotating out of the stocks that were more sensitive to the market, beginning at Monday’s open.
Momentum investors were almost immediately penalized, while low volatility investors were consequently rewarded. The sell-off in high-beta stocks continued throughout Monday, then abated later in the week.
One consistent lesson from market crises is the need for transparency into the underlying risks to which portfolios are exposed. High frequency indexes, and insights on factor exposures, provide deeper understanding for equity factor investors.
The author thanks Raman Aylur Subramanian for his contributions to this blog post.
1 FaCS is a new proposed standard for analyzing and reporting style factors in equity portfolios.
Further reading:
Dissecting the stock market sell-off
Creating a common language for factor investing
Fast-moving markets: Revising the August 2007 Quant Crunch in real time
