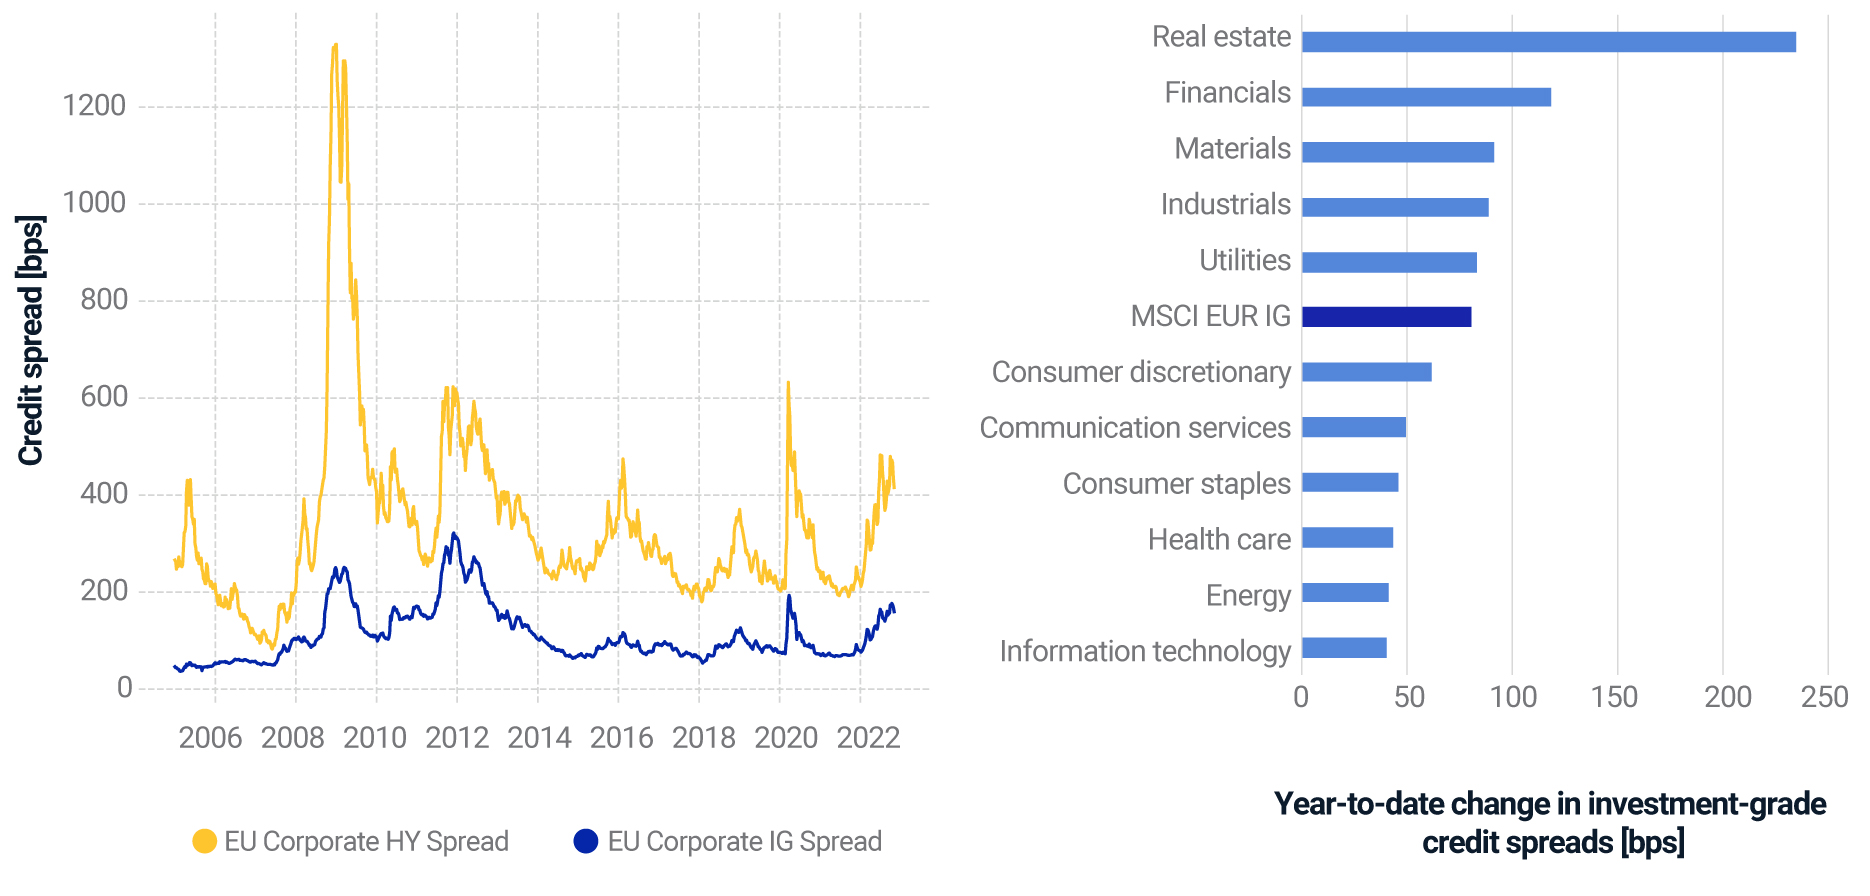
- Year to date, European credit spreads have approached levels seen during the pandemic, with real estate, financials and energy-dependent sectors being most affected.
- Further evolution of credit spreads in the coming months could depend on the stability of energy supplies and severity of the recession.
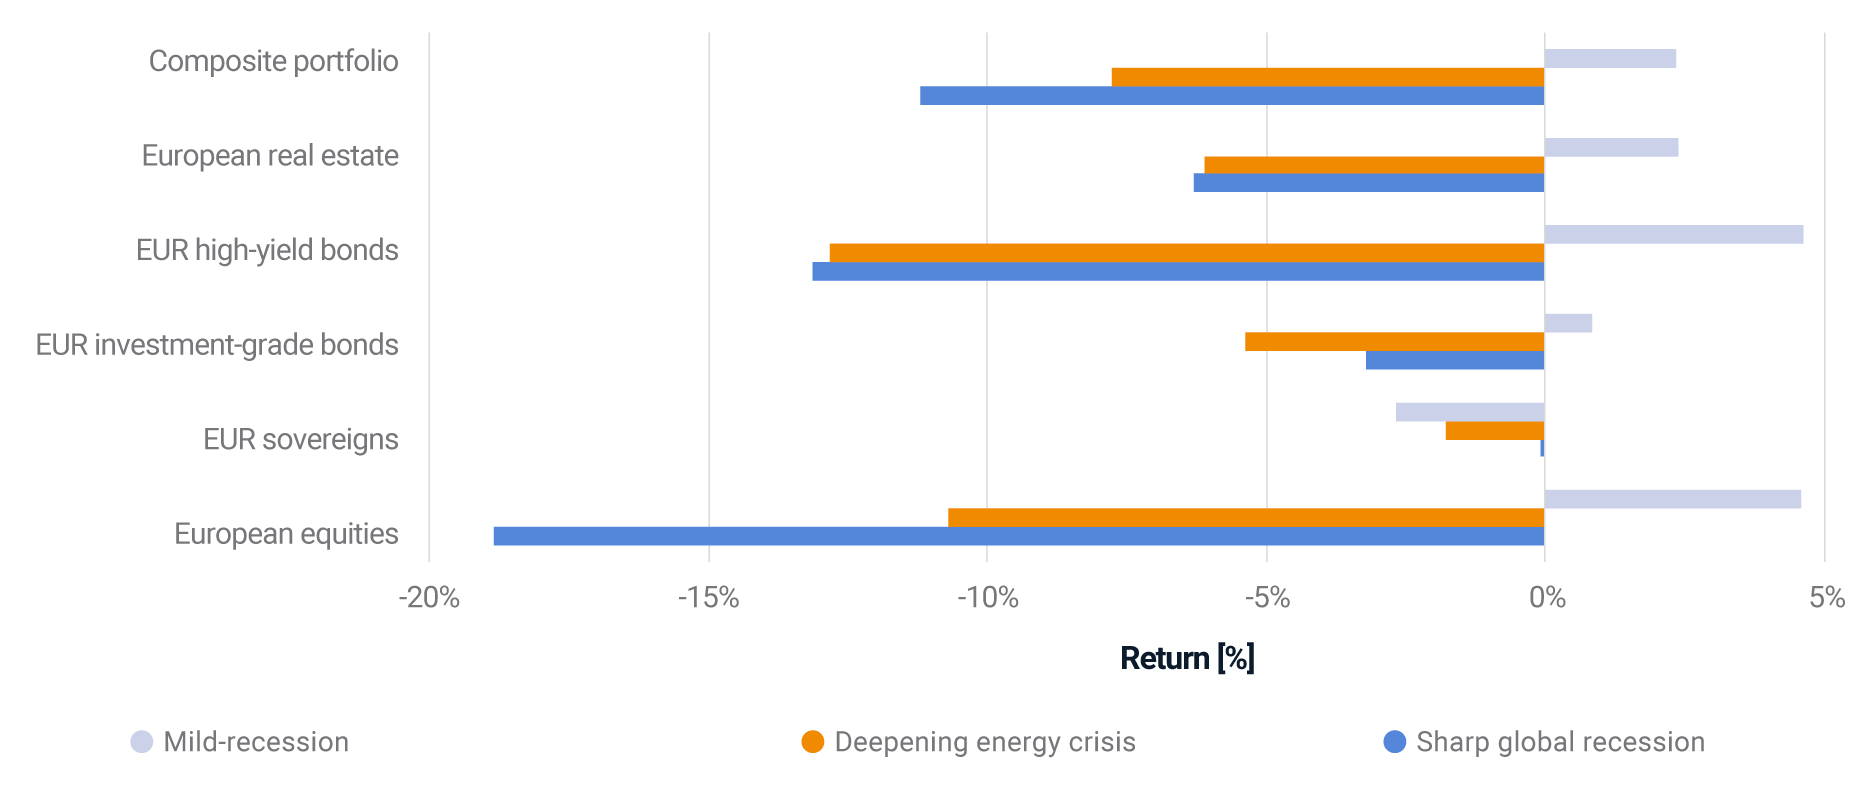
- In our “deepening energy crisis” scenario, assuming Europe struggles with energy shortages, a portfolio of European equities and bonds could lose around 8% in the months ahead, according to our model.
Although emergency natural-gas storages are almost fully stocked,1 and governments across Europe have tried to partially shield households and corporations from rising energy prices,2 the eurozone’s economic outlook for 2023 remains uncertain. Continued disruptions in the energy supply could put further pressure on businesses’ financial stability, and we might see credit spreads continue to widen. We explore three scenarios of varying severity for European credit, with outcomes for a European portfolio of equities and bonds ranging from a 2% return in our “mild recession” scenario to an almost 11% drop in our “sharp global recession” scenario.
How European credit spreads reacted to this year’s turbulence
In the year to date period, credit spreads have nearly reached levels last seen during the pandemic. The real estate Global Industry Classification Standard (GICS®) sector3 registered the highest spread, widening in both relative (185%) and absolute terms (241 basis points (bps)), mostly driven by the real estate management and development industry, which has battled rising funding costs.4 Credit spreads in the energy-dependent sectors — namely materials, utilities, industrials and consumer discretionary — approximately doubled. As European manufacturing was heavily reliant on imported natural gas from Russia, these sectors were exposed to disruptions in the energy supply.
Changes of European corporate-bond spreads and average option-adjusted spread across sectors

Chart on the left: evolution of European investment-grade and high-yield corporate-bond spreads. Chart on the right: change in the weighted average option-adjusted spread of GICS sectors in the MSCI EUR Investment Grade Corporate Bond Index from Jan. 1, 2022, to Nov. 11, 2022.
Three hypothetical scenarios for European credit
With the uncertainty around energy prices and the European and global economic outlook, we considered the impact of three scenarios on portfolios of European stocks, bonds and real estate:5
- Mild recession: Most optimistic scenario, with economic headwinds softening. Credit spreads revert to levels seen during the spring of 2022 and equities partially recover from this year’s losses. The yield curve steepens as part of the normalization and inflation trends downward.
- Deepening energy crisis: Europe struggles with energy shortages, keeping inflation expectations elevated. The European Central Bank’s rate hikes are not slowed down and the yield curve inverts. Credit spreads continue widening. European equities lose more.6
- Sharp global recession: A large-scale recession hits the global economy. European credit and equities reach a total drawdown comparable to that seen during the 2008 global financial crisis. Amid the global recession, central banks slow rate hikes, yields come down and inflation expectations drop.7
What we assume in our scenarios

Potential implications for financial portfolios
To assess the scenarios’ impact on multi-asset-class portfolios, we used MSCI’s predictive stress-testing framework and applied it to a hypothetical European diversified portfolio.8 This composite portfolio was hit most in our “sharp global recession” scenario, with a loss of about 11% driven by the 20% drop in European equities. The “deepening energy crisis” turned out to be hardest on high-yield bonds (-13%), with the total portfolio losing 8%. In the “mild recession” scenario, moderate gains in equities and corporate bonds resulted in a 2% gain for the composite portfolio.
Impact across asset classes under our scenarios

Portfolio impact of the scenarios based on market data as of Nov. 11, 2022. Equity markets and sovereign and corporate bonds are represented by MSCI indexes. Private equity is represented by model portfolios. European real estate is represented by the MSCI Pan-European Quarterly Property Fund Index. The composite Europe portfolio is represented by the following weights: 60% European equities, 20% European sovereign bonds, 15% European investment-grade bonds and 5% European high-yield bonds.
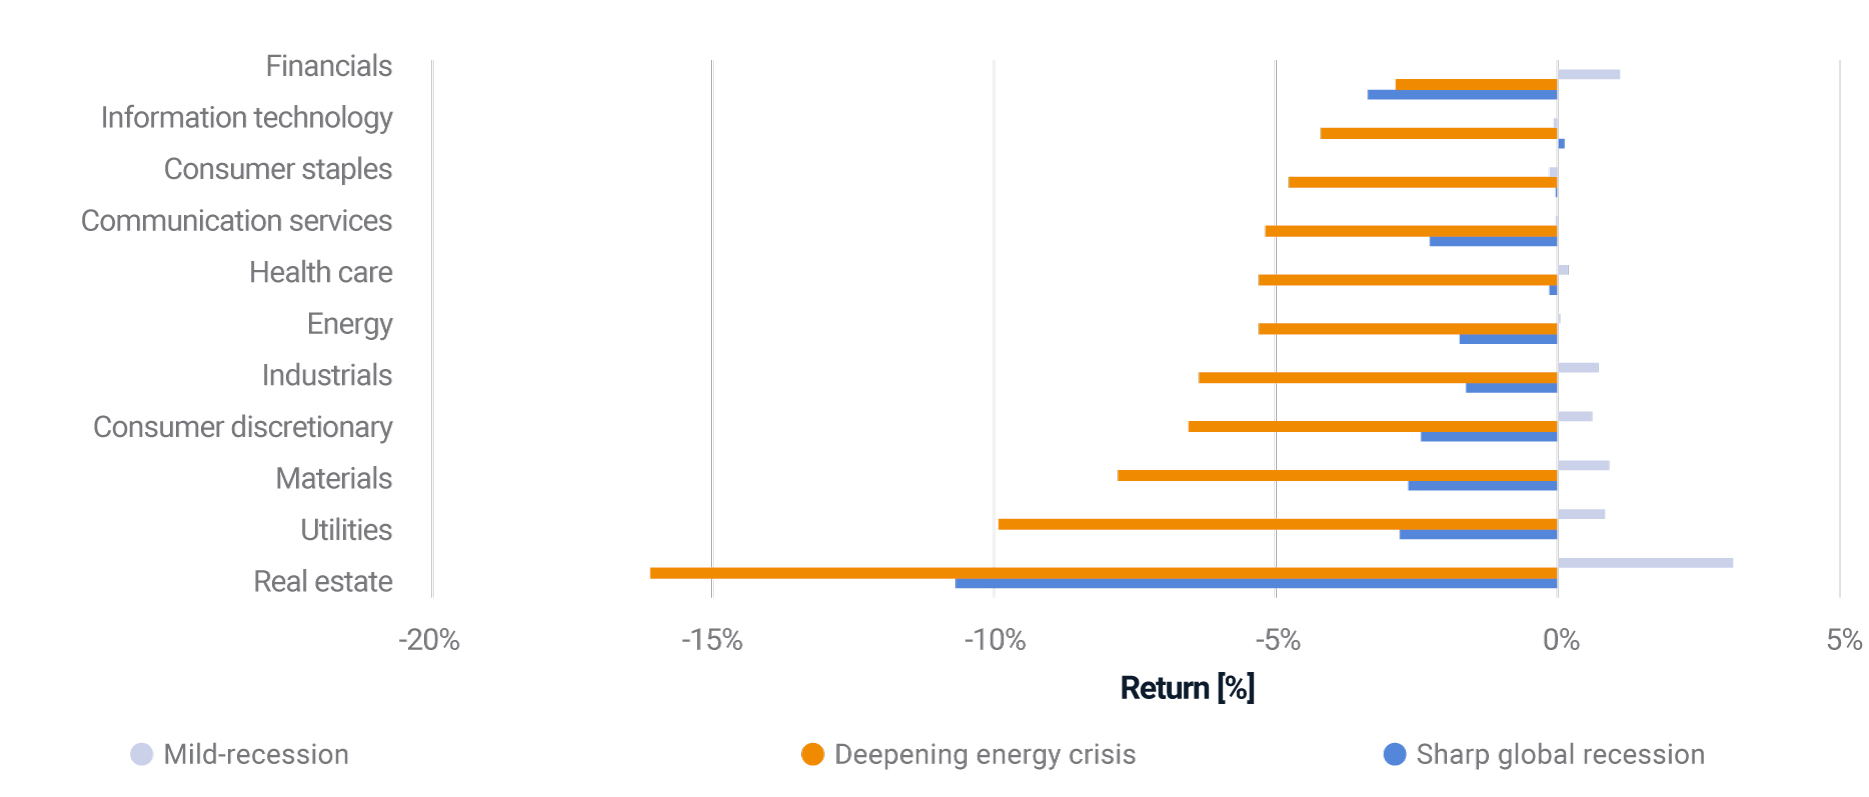
Zooming in on sectoral results in the MSCI EUR Investment Grade Corporate Bond Index, we saw the energy-intensive sectors being hit hard in the “deepening energy crisis,” and to a lesser extent in the “sharp global recession,” as shown in the exhibit below. The real estate sector also sustains considerable losses under these scenarios, given its sensitivity to macroeconomic headwinds.
Impact across sectors in the MSCI EUR Investment Grade Corporate Bond Index

Impact of the scenarios based on market data as of Nov. 11, 2022.
The levels of the gas supply and economic environment will be key for European credit portfolios in the months to come. Given the uncertainty around these factors, investors can prepare by assessing a range of outcomes.
1Dezem, Vanessa, and Brambilla, Alberto. “Europe’s Gas Stores Are Almost Full. But There’s a Catch.” Bloomberg, Oct. 20, 2022.
2Sgaravatti, Giovanni, Tagliapietra, Simoni, and Zachmann, Georg. “National policies to shield consumers from rising energy prices.” Bruegel, Sept. 22, 2022.
3GICS is the industry-classification standard jointly developed by MSCI and S&P Global Market Intelligence.
4Hammond, George. “European office market faces biggest test since financial crisis.” Financial Times, Aug. 15, 2022.
5The shocks in these scenarios are not meant to be instantaneous, but rather on a horizon of roughly three months, as changes in the market will take time to materialize.
6We emphasized the hit on the energy-dependent sectors’ credit spreads, with an added shock on European utilities apart from spread shocks to investment-grade and high-yield bonds.
7For propagating shocks, we used the factor-covariance matrix as of September 2008 to mimic the close interdependence in the market during a global recession.
8The results are generated based on this methodology, using MSCI's BarraOne®, whereby we used current correlations to propagate the shocks to a hypothetical multi-asset-class portfolio. MSCI clients can access BarraOne® and RiskMetrics® RiskManager® files for these scenarios on the client-support site.
Further Reading
European Governments Rescue Utilities Amid Gas Crisis
