- Investing across geographical borders has historically offered significant diversification opportunities, yet many global indexes have understated the economic importance of emerging markets.
- In developed markets a handful of large technology companies accounted for a significant percentage of recent performance and omitting geographical or size segments would have had a substantial impact on returns.
- Over long periods, starting valuations and dividend growth have been primary factors in explaining equity market performance.
Over the last few decades, increasing global economic and financial integration promoted economic development and enabled investors to seek opportunities and spread risks across national borders. Earlier this year, the Ministry of Finance of Norway, which oversees the NOK 10 trillion (USD 1 trillion) Government Pension Fund Global, commissioned MSCI to produce a report on the changing characteristics of global equity markets and the challenges and opportunities that international investors face in the current economic environment. This report highlighted five key points , which we review in this post.
Opportunities from investing across borders
The interconnectedness of equity markets around the world means they are often affected by geographical proximity, economic development and market accessibility. Splitting global markets across two dimensions — level of development and geographical position — has resulted in correlation clusters, as the heatmap below illustrates.
Equity market correlation clusters
Developed markets have been fairly homogeneous, with even stronger correlations within each of the three main geographies and time zones (North America, EMEA and Asia-Pacific). Emerging markets have been a diverse but distinct segment, with some homogeneity within the same three main geographical clusters. This analysis implies that the standard framework of classifying markets into developed and emerging was supported by empirical evidence based upon market correlations. It also suggests that investors may seek diversification by allocating capital across markets with different geographical locations and levels of economic development.
The growing importance of emerging markets
Looking at emerging markets through the lens of globally listed public equities may understate their importance. Although emerging markets represent only 12% of global free float (as proxied by the MSCI ACWI IMI), they account for 24% of global full market cap, 39% of world GDP and 42% of global corporate revenues as of Feb. 28, 2019. The generally transformative effects of globalization on emerging markets and the changing role these markets play in the global economy can also be illustrated by the increasing share of revenue derived by global companies from emerging markets over the last 15 years.
Share of revenue from emerging markets increased
Data from Dec. 31, 2002, to Feb. 28, 2019
The chart shows that, at the beginning of 2003, corporate revenues from emerging markets represented less than 10% of global revenues. As many of these markets developed gradually and transitioned from low-end manufacturing to higher added-value economic activities and to domestic consumption, corporate revenues generated in these markets increased fourfold to over 40%.
The influence of large technology companies
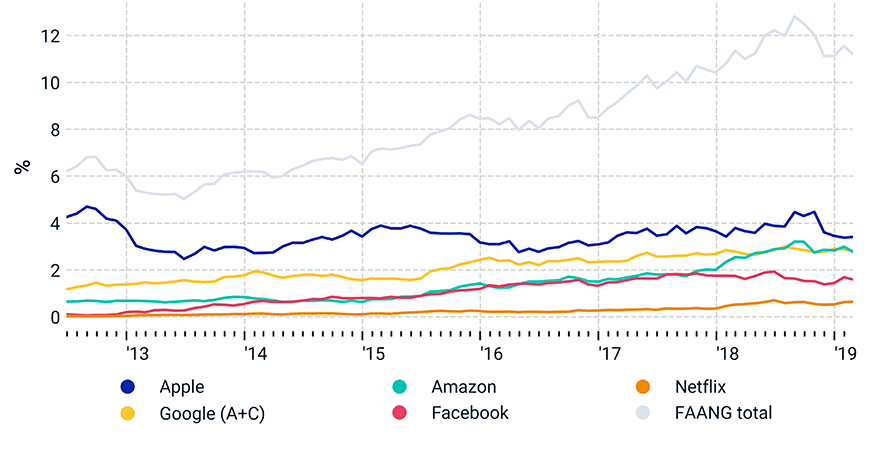
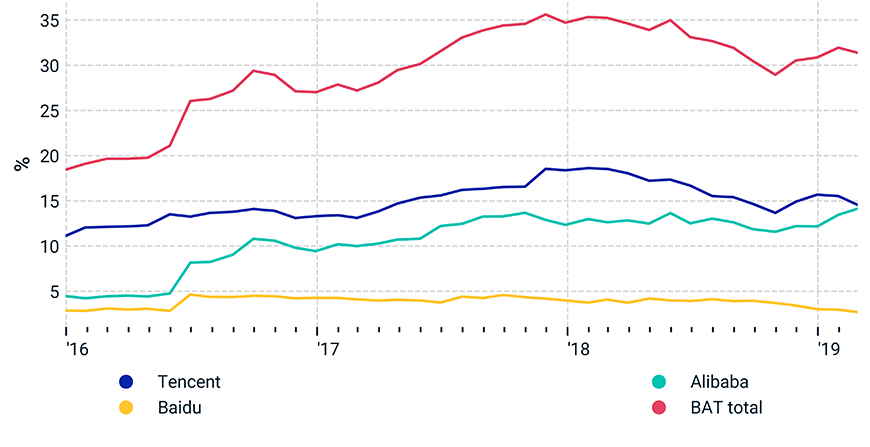
Global markets became increasingly concentrated in recent years. Many new growth companies such as Uber and Airbnb remained private and continued to rely on private sources of funding for longer periods. At the same time, several large, publicly traded, technology companies attained dominant roles in terms of portfolio allocation and performance.
Tech stocks made outsized contributions to performance


Source: MSCI. Period from June 29, 2012, to Feb. 29, 2019
| Metrics | U.S. | U.S. ex FAANG | China | China ex BAT |
|---|---|---|---|---|
| Total return (%) | 10.54% | 9.56% | 8.76% | 6% |
Data from Feb. 28, 2014, to Feb. 28, 2019.
FAANG stocks (Facebook Inc., Apple Inc., Amazon.com Inc., Netflix Inc. and Google LLC) and BAT stocks (Baidu Inc., Alibaba Group Holding Ltd. and Tencent Holdings Ltd.) are two well-known, albeit somewhat arbitrary, groupings that demonstrate this phenomenon. The five FAANG stocks accounted for over 10% of the U.S. public equity market as of Feb. 28, 2019. Excluding them from an indexed U.S. equity portfolio would have reduced the return by over 1% per year over the five years ended Feb. 28, 2019. The three BAT stocks made up over 30% of the MSCI China Index, and removing them from the index would have reduced performance by almost 3% annually, over the same five-year period. These statistics underline the critical importance of being aware of concentration risk in global equity portfolios.
Geographical and size segments mattered
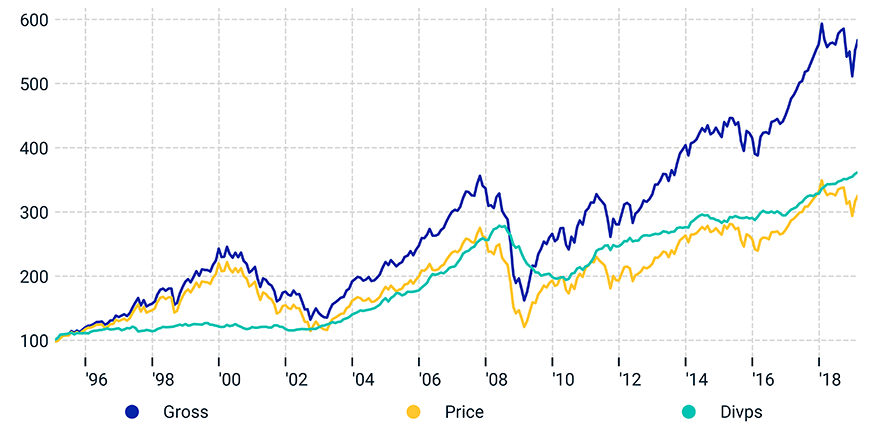
The MSCI ACWI IMI contained more than 9,000 stocks from 49 countries as of Feb. 28, 2019. Was exposure to all these countries and securities necessary to capture the full benefits of global investing? Limiting the opportunity set over the past 25 years would have affected the risk and performance characteristics of a global portfolio.
Effects of a limited investment universe
Omitting small-cap securities from a global equity portfolio represented by the MSCI ACWI IMI would have reduced performance by over 4% during the period from December 1994 to February 2019, depriving investors of the premium (over large-cap securities) offered historically by the segment. Omitting emerging markets altogether had an even more substantial impact on a global equity portfolio. Performance varied over different time periods, but for the entire period from December 1987 to February 2019 — the longest period for which we have consistent emerging-market index data — the MSCI Emerging Markets Index outperformed the MSCI World Index by almost 3% per year.
Equity market performance over long horizons
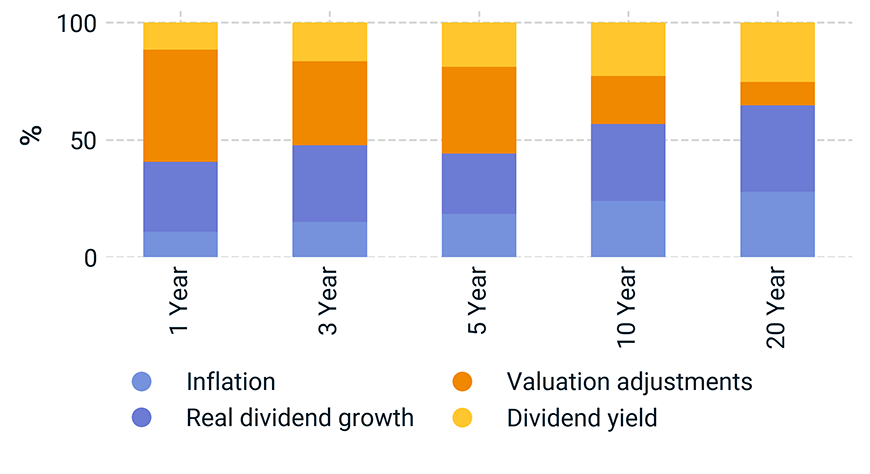
Equity market prices historically have been more volatile than earnings and dividends over longer time horizons. As a result, price changes (valuation adjustments), drove equity portfolio performance in the short term. Over one-year periods, price changes explained over 50% of equity returns. But as the investment horizon increased, the fundamentals (namely, dividend yield and dividend growth) became the dominant sources of performance, explaining more than 90% of total equity returns over 20-year horizons across that same period. In other words, over the long term, the importance of price changes diminished and the focus shifted to starting valuations (dividend yield) and income growth (dividend growth).
Explaining performance over different horizons


Source: MSCI, OECD. Data from Dec. 30, 1994, to Feb. 28, 2019. Inflation data is based on U.S. inflation (CPI) levels.
Separating signals from noise
Financial markets are inherently unpredictable, buffeted in the short term by emergent phenomena, non-ergodicity, radical uncertainty and computational irreducibility.1 Structural forces such as shifts in monetary policy, trade conflicts and climate change compound the challenges facing investors. Analyzing historical relationships may yield important insights into the long-term drivers of financial markets and provide vital beacons for long-term investors.
The author thanks Guido Giese, Roman Kouzmenko and Navneet Kumar for their contributions to this post.
1For a discussion of these forces affecting financial markets, see Bookstaber, R. 2017. “The End of Theory.” Princeton University Press.
Further Reading
Selected geographic issues in the global listed equity market
