
- While the five flagship MSCI ACWI ESG Indexes underperformed the MSCI ACWI Index in 2022, the MSCI ACWI ESG Universal and MSCI ACWI ESG Leaders Indexes outperformed the MSCI ACWI Index for the fourth quarter.
- The full-year underperformance was primarily driven by the outperformance of the energy sector as well as a rally in value stocks, although there was a positive contribution from higher-rated ESG companies.
- The MSCI ACWI ESG indexes continued to have a robust ESG profile and meet their values alignment and ESG integration objectives.
The underperformance of the MSCI ACWI ESG Indexes in 2022 was a global trend, with the ESG indexes underperforming their respective parent index across most regions (as shown below). The performance of the MSCI ACWI ESG Indexes has been negatively impacted this year by higher oil prices and the associated outperformance of the energy sector. The MSCI ACWI ESG Indexes are constructed to avoid significant concentration of Global Industry Classification Standard (GICS®)1 sector exposures. However, the application of values-based exclusions or climate-related investor preferences especially in the ESG Leaders and SRI Indexes, introduces industry exposures such as an energy-sector underweight. Both crude and natural gas prices have declined from the highs seen earlier in 2022, and this helped the relative performance of ESG Universal and ESG Leaders Indexes in the fourth quarter.
The performance of ESG Indexes across regions
The table shows performance of the regional variations of the MSCI ESG Screened, MSCI ESG Universal, MSCI ESG Focus, MSCI ESG Leaders and MSCI SRI Indexes in 2022. The bar chart shows the active returns of the same indexes by region and country in 2022, as well as for each quarter in 2022.
A reversal of industry performance cast a shadow
Higher energy prices contributed to a reversal in industry performance in 2022. MSCI ACWI ESG Indexes historically had lower relative allocations to the energy sector and higher relative allocations to the information technology sector as compared to the MSCI ACWI Index. While these allocations had contributed to the outperformance of MSCI ACWI ESG Indexes in the past decade, the same did not hold true for 2022. As shown below, the MSCI ACWI ESG Indexes outperformed the MSCI ACWI Index with lower risk and a higher Sharpe ratio from 2012 to 2021.
The MSCI ACWI ESG Indexes relative risk and return profile (2012-2021)
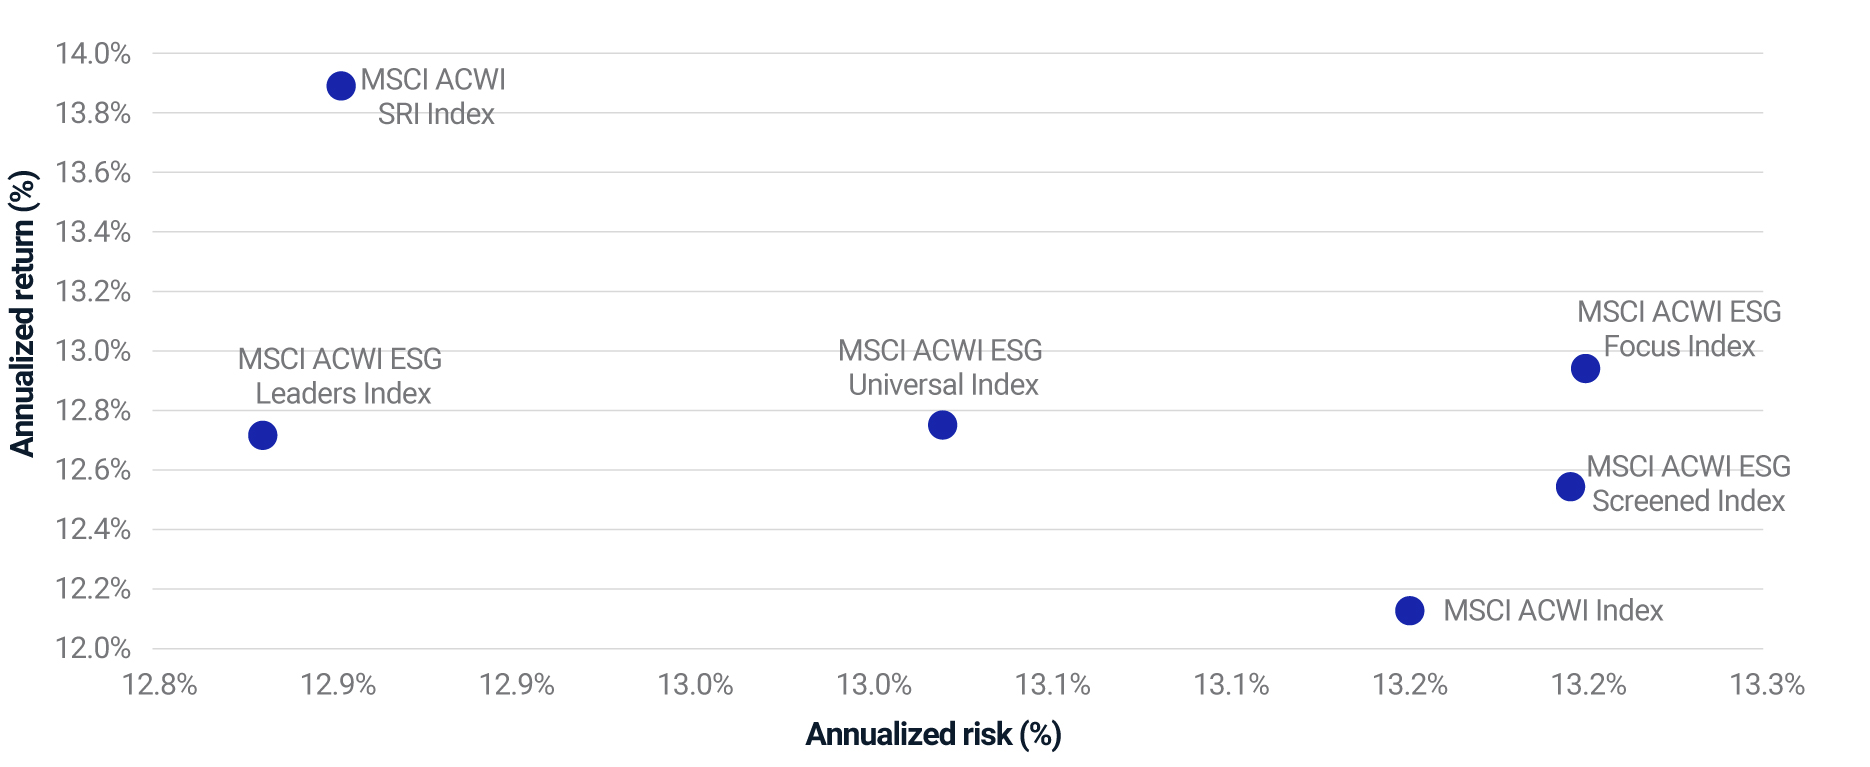
The chart shows total annualized risk and return for the MSCI ACWI ESG Indexes relative to the MSCI ACWI Index. From Nov. 30, 2012, to Dec. 31, 2021.
The MSCI ACWI ESG Indexes apply exclusions to controversial weapons companies, and some indexes like the MSCI ACWI ESG Leaders and MSCI ACWI SRI Indexes also exclude manufacturers of conventional weapons, civilian firearms and nuclear weapons. The rise in geopolitical tensions in 2022 contributed to the outperformance of companies in the aerospace and defense industry, further impacting the performance of the MSCI ACWI ESG Indexes. However, the MSCI ACWI ESG Focus Index was less impacted by the industry performance reversal due to strict controls on tracking error and sector allocations.
An industry performance reversal impacted the MSCI ACWI ESG Indexes
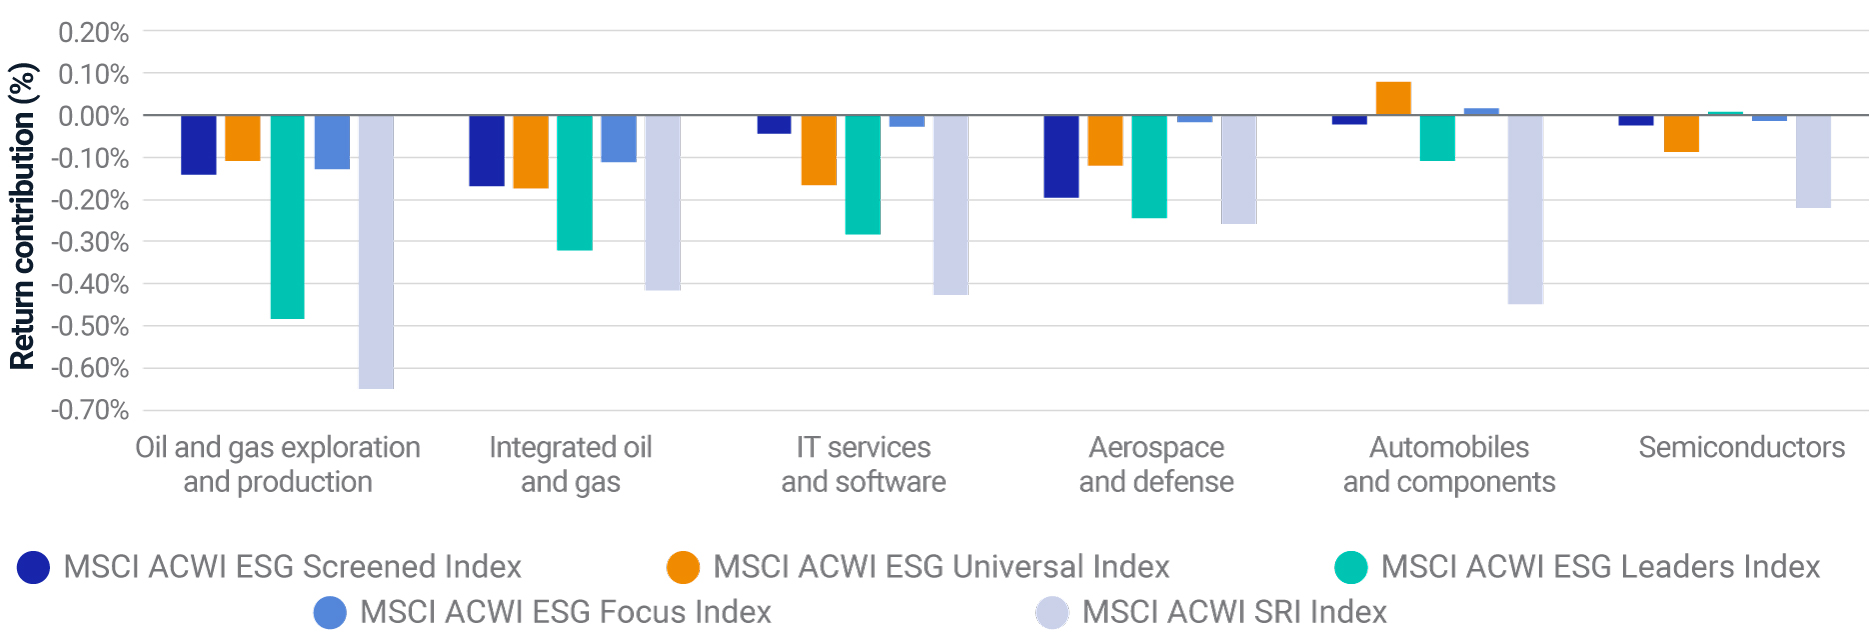
The 2022 industry detractors aided performance between 2012-2021
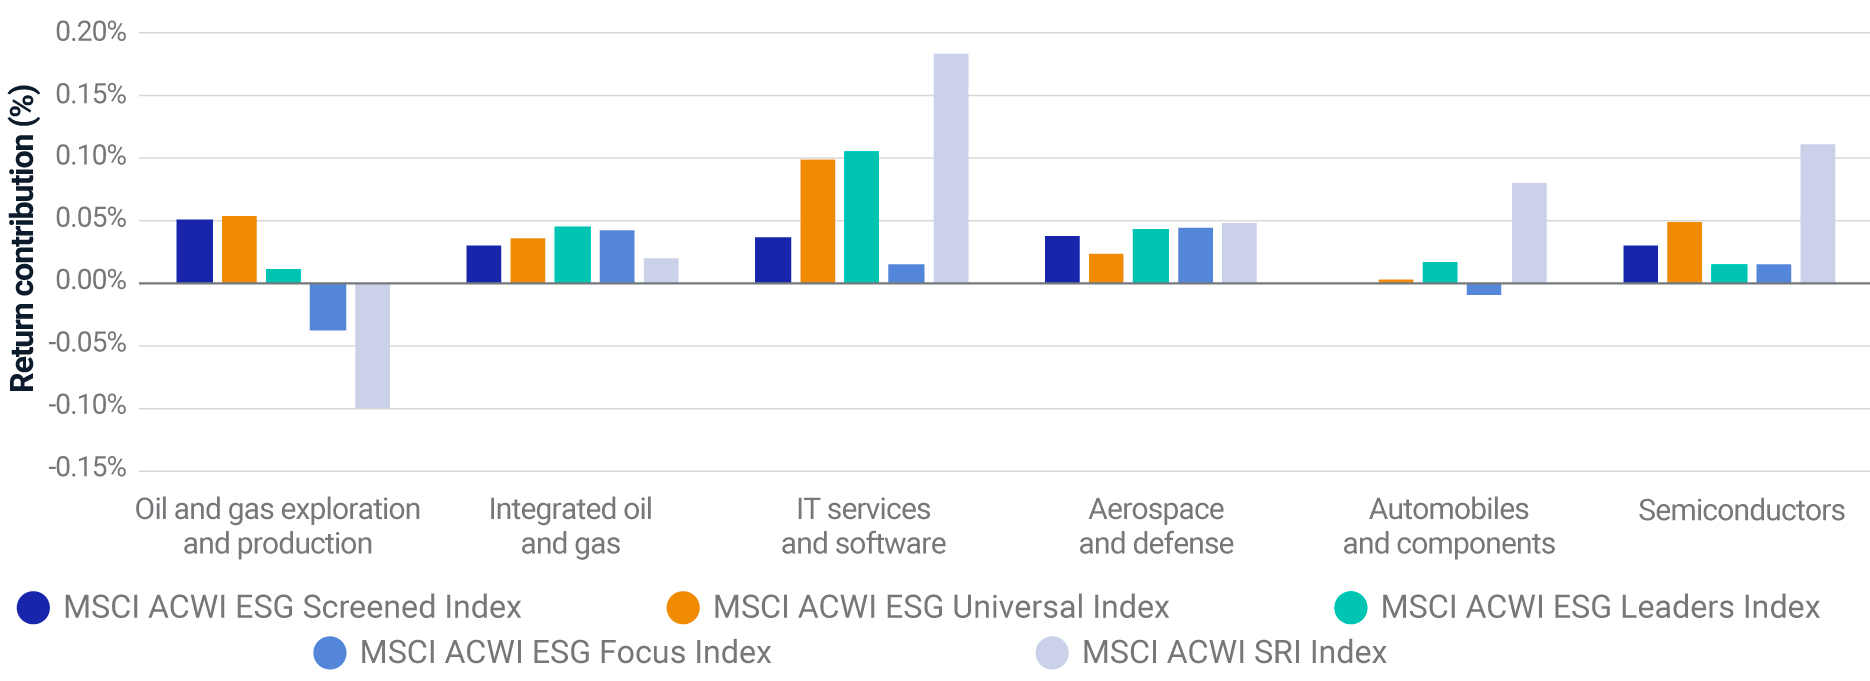
The top chart shows the return contribution to the MSCI ACWI ESG Indexes from select industry factors in 2022, while the bottom chart reflects the return contribution for same industry factors from Nov. 30, 2012, to Dec. 31, 2021. The risk model is the MSCI Global Equity Factor Model risk model (EFMGEMLT).
Style-factor allocations also played a role
Other impactful macroeconomic events in 2022 included high inflation and rising interest rates, and this economic coupling has historically been constructive for companies with low valuations. We previously highlighted that high-ESG-rated companies historically generally had higher valuations, higher profitability and lower idiosyncratic volatility. The MSCI ACWI ESG indexes that used MSCI ESG Ratings for security selection or allocation2 exhibited similar characteristics than in the past. These attributes included lower allocations to companies with low valuations, higher allocations to companies with strong fundamentals (quality), and higher allocations to low-idiosyncratic and systematic-risk companies. The rally in value stocks this year and the quality drag were the primary detractors from performance of the MSCI ACWI ESG Indexes (as shown below). Conversely, the contribution from less-risky companies continued to be positive. We should note that the MSCI ACWI ESG Focus Index was less impacted by the value outperformance and quality drag due to the aforementioned controls.
The MSCI ACWI ESG Indexes have historically benefitted from a significant return contribution from the ESG factor,3 and this trend continued in 2022, albeit to a lesser extent. Our analysis also indicates that higher ESG-rated companies produced higher returns after removing the effect of industries, countries and other fundamental characteristics.
ESG and low-risk exposures contributed while value and quality detracted
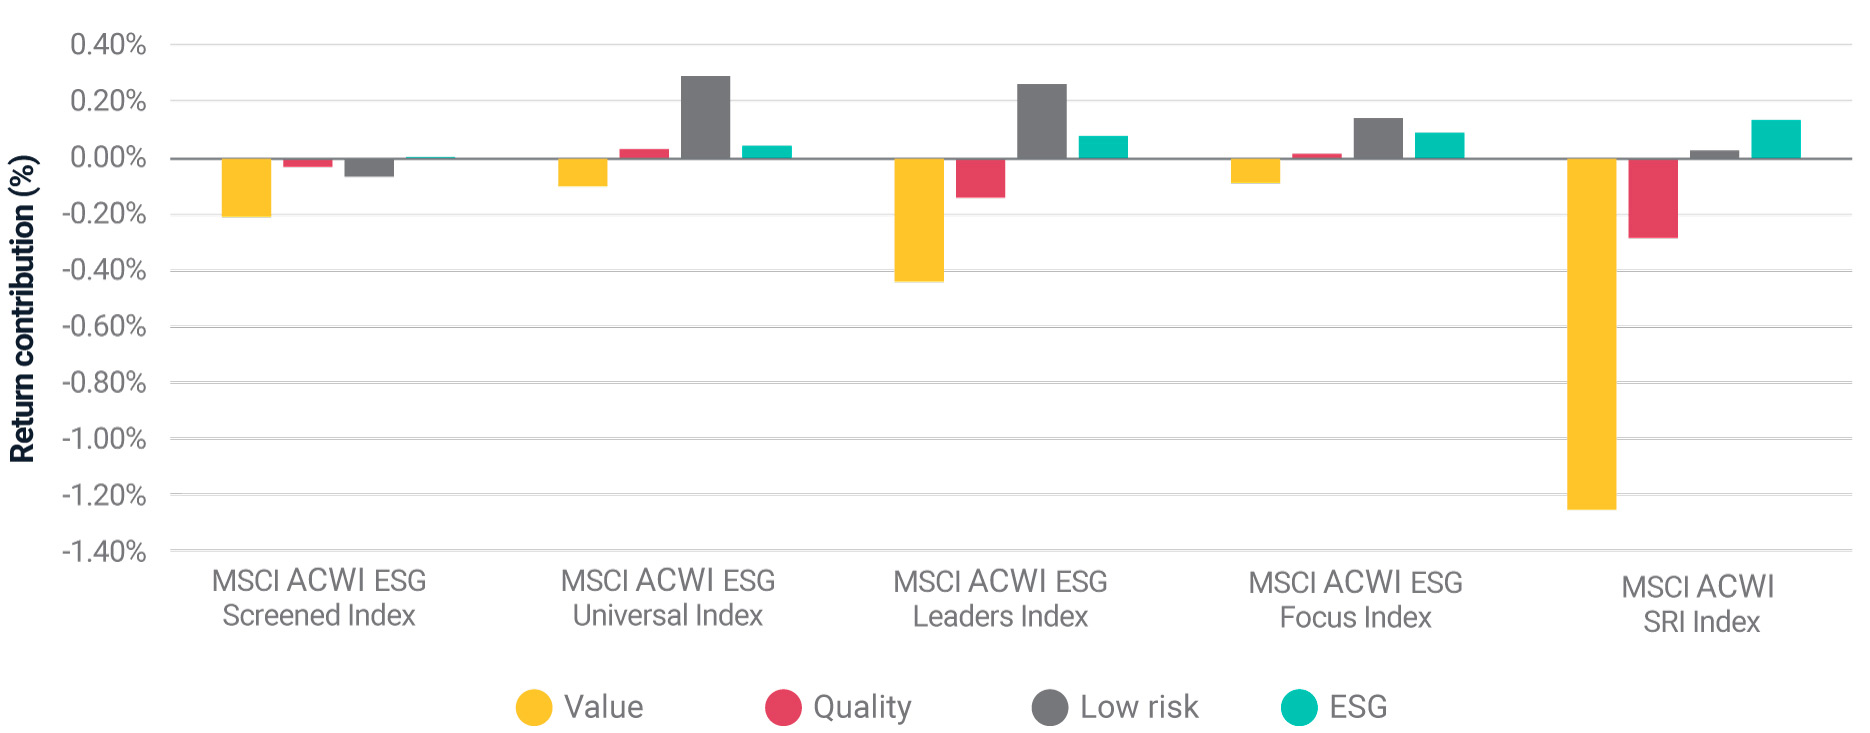
The 2022 style-factor detractors generally aided performance between 2012-2021
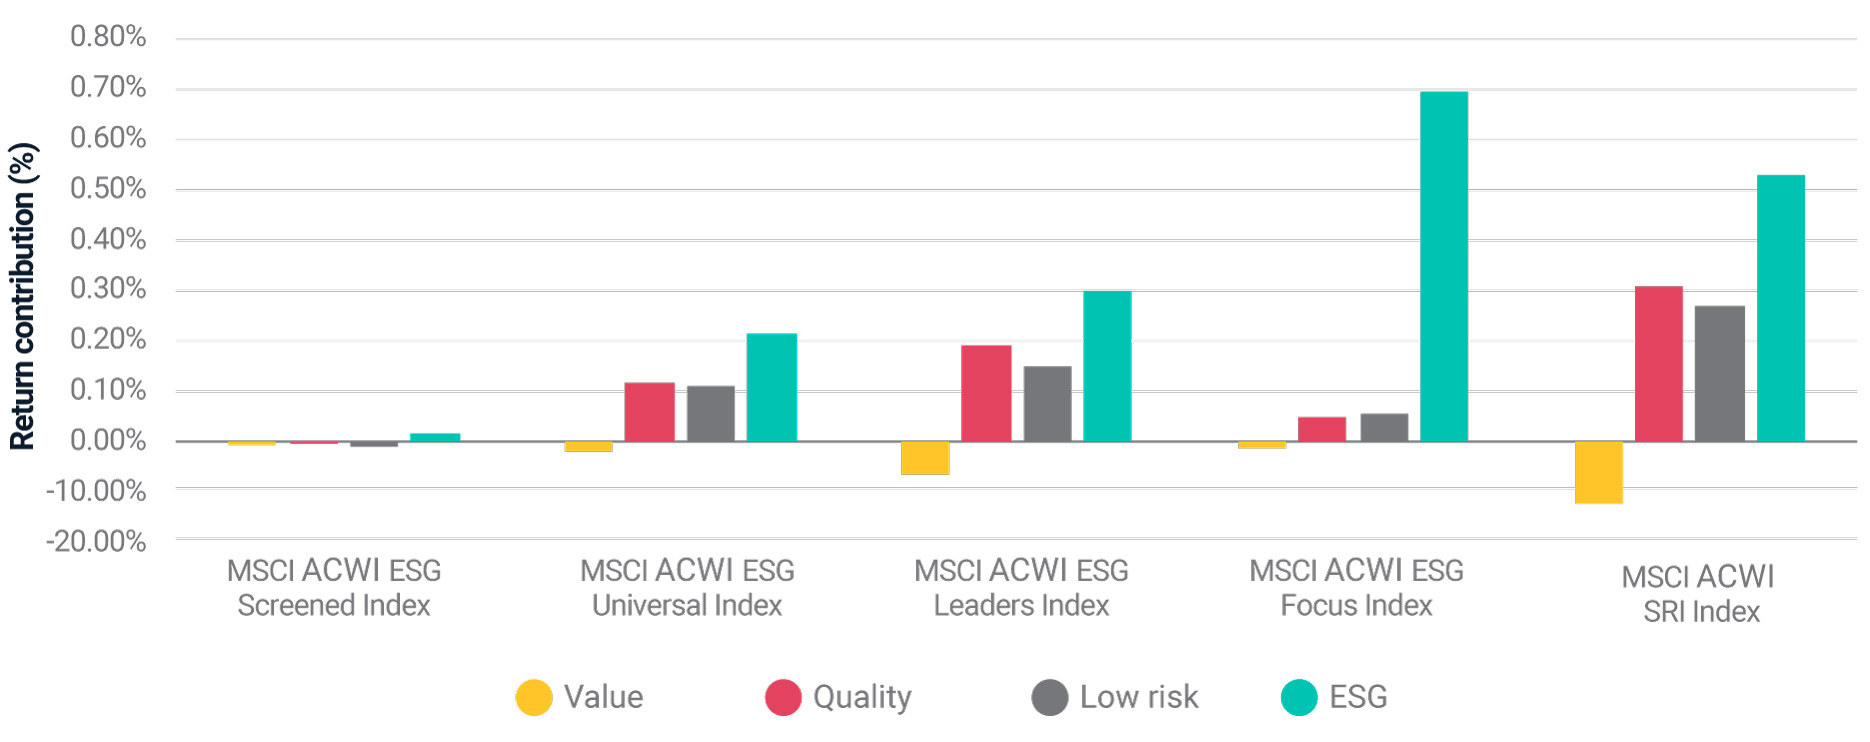
The top chart shows the return contribution to the MSCI ACWI ESG Indexes from select risk factors in 2022, while the bottom chart shows the return contribution for the same risk factors between Nov. 30, 2012, and Dec. 31, 2021. The risk model is EFMGEMLT and factor contributions have been aggregated using MSCI FaCS definitions.
The importance of meeting ESG objectives
Institutional investors have fiduciary responsibilities, which means that they are mindful of the risk-adjusted return characteristics of ESG indexes. Similarly, an important mandate of the ESG indexes is that they meet individual ESG objectives. As in 2020 and 2021, the MSCI ACWI ESG Indexes had superior ESG scores relative to the MSCI ACWI Index in 2022, especially the indexes using ESG ratings for security selection or allocation (as shown below).
The ESG score improvement for the MSCI ACWI ESG Indexes
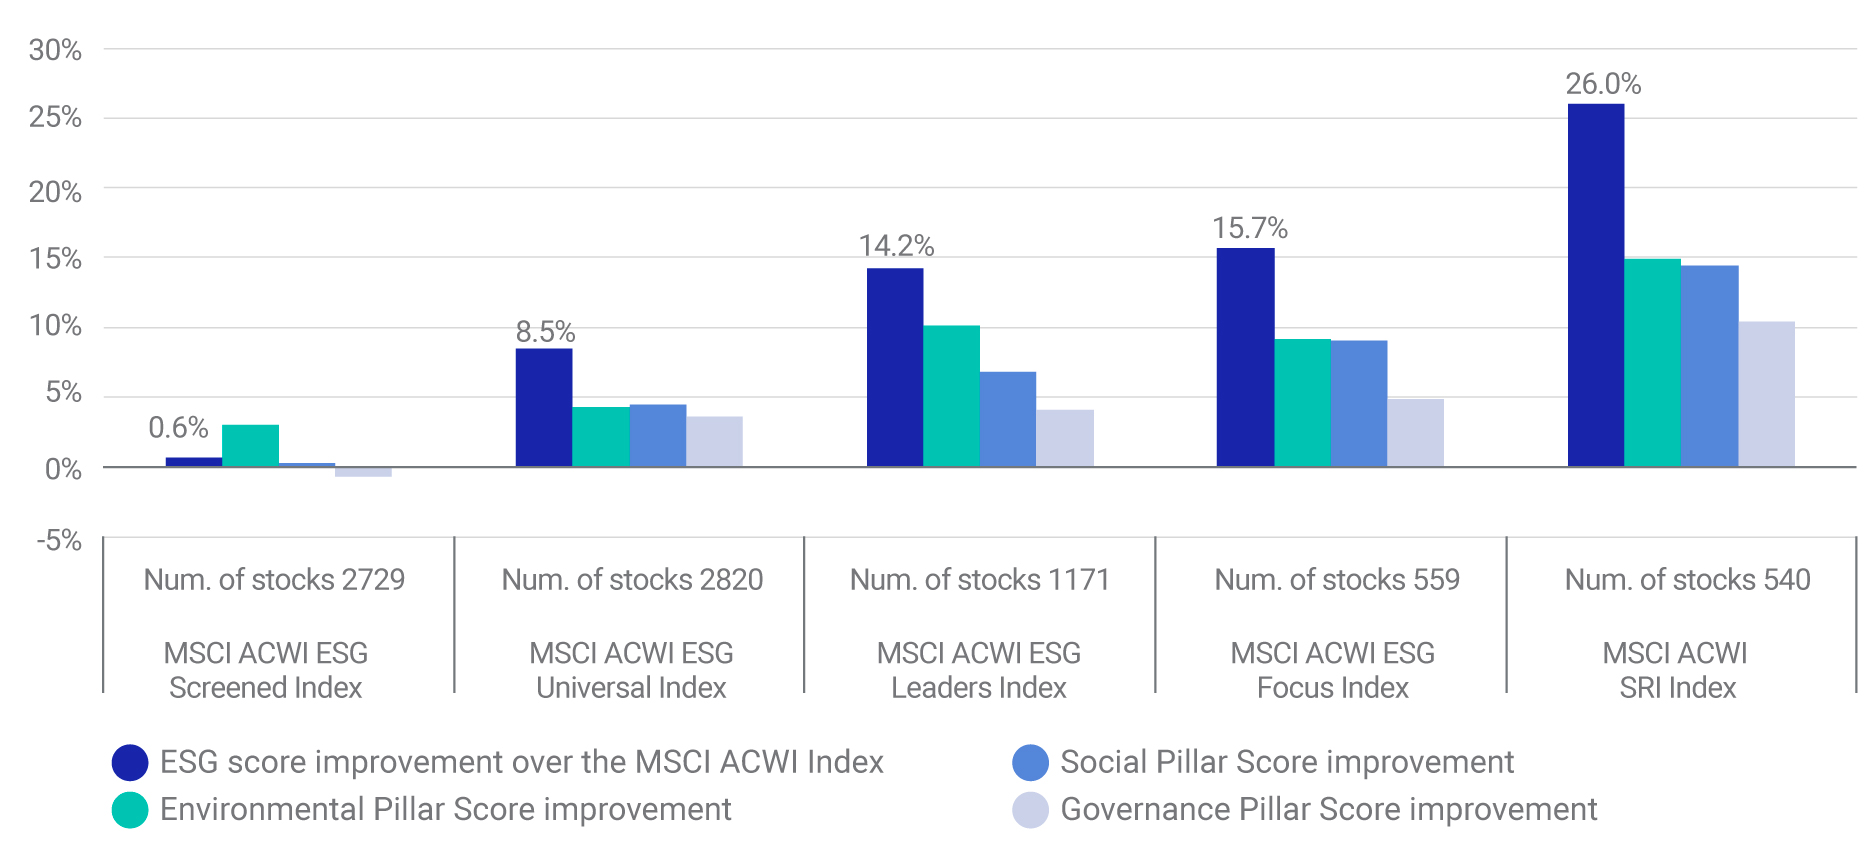
The chart shows the ESG score improvement as well as E, S and G pillar score improvement for the MSCI ACWI ESG Indexes relative to the MSCI ACWI Index in 2022. Based on monthly averages.
We detail below how the five flagship MSCI ACWI ESG Indexes met their respective values-alignment criteria in 2022.4
Values principles in detail

The table shows select value and norms criteria used in the MSCI ESG indexes for values alignment. As of Dec. 30, 2022.
1 GICS®, the global industry classification standard jointly developed by MSCI and S&P Global Market Intelligence.
2 We refer here to MSCI ACWI ESG Universal, MSCI ACWI ESG Leaders, MSCI ACWI ESG Focus, and MSCI ACWI SRI Indexes.
3 We refer to the ESG factor as defined by MSCI Global Equity Factor Model.
4 The MSCI ESG Screened Index applies exclusions consistent with the values-alignment approach. The MSCI ESG Universal, ESG Leaders, ESG Focus and SRI Indexes apply simultaneously ESG integration approach and varying levels of exclusions for value alignment.
Further Reading
ESG and Climate Trends to Watch for 2023
Climate Indexes' Year in Review: The Journey Toward a Low-Carbon Transition
ESG Indexes Lifted by Carbon-Efficient Firms but Underperformed
