- The recent drop of stocks and bonds together led to fears that U.S. Treasurys were no longer the safe haven they had been in previous crises — and to fears of a structural break in the markets.
- Looking beyond a short period of illiquidity, the relationship between bonds and stocks has shown no signs of changing.
- Overall, Treasurys actually provided somewhat more downside protection than suggested by pre-crisis correlations, and the rates-equity correlation was actually even stronger over this period.
Much has been made of bonds and equities recently falling at the same time. Has the bond-equity correlation flipped? Has there been a fundamental regime shift in the structure of markets? Did the benefits of balanced strategies fail when needed the most? Contrary to what we may now be hearing, so far the answer to all of these questions appears to be the same: No.
For most of the past two decades, a negative correlation with equity has meant that U.S. Treasurys acted as a hedge when stock markets tumbled. Falling sentiment usually coincided with falling expectations for interest rates and a flight to quality into Treasurys. So bond prices tended to rise when equity fell, and balanced portfolios suffered smaller losses than equity alone.
Is the current crisis challenging historical correlations?
As investors navigated the recent market sell-off, some were alarmed to see Treasurys drop alongside equity. Between March 10 and 18, the MSCI USA Index fell about 13%, while bond prices also fell and the yield on 10-year Treasurys rose by 75 basis points (bps). Did this signal the end of the balance between bonds and equity?
We attribute the midmonth bond rout to a rush for liquidity. As in previous crises, the most liquid assets can suffer large losses when investors scramble for cash. In this case, even as the Federal Reserve was slashing short-term rates and about to resume quantitative easing with bond purchases, the demand for liquidity pushed the 10-year’s yield higher. But this dislocation was quickly reversed, and rates soon fell.
If we look at the movement of yields since the beginning of the sell-off, the picture looks very different. The exhibit below looks at the short-term liquidity dislocation in the context of the full crisis. The charts compare rates and equities and introduce the “equity-implied rates,” which reflect the change in rates that the pre-crisis correlation would imply in a flight to quality from equity.1
The short period of reversal followed a historic bond rally

The cumulative changes of the 10-year Treasury’s yield (blue) between Feb. 19 and March 27, 2020, and such changes implied by equity-market returns and their pre-crisis correlation with rates (yellow), calibrated using MSCI’s long-horizon multi-asset-class model. The shaded area highlights the period of a short-term dislocation. Source: MSCI Multi-Asset Class Factor Model, RiskMetrics® RiskManager®.
Historically, a 1% return in equity typically coincided with about a 2-bp increase in the 10-year Treasury’s yield. By March 9, 2020, the MSCI USA Index had already fallen nearly 20% from its Feb. 19 level, which would imply a 40-bp decrease in the 10-year yield if the historical relationship were to persist. By then, however, the 10-year yield had already fallen almost three times that, a total of 107 bps.
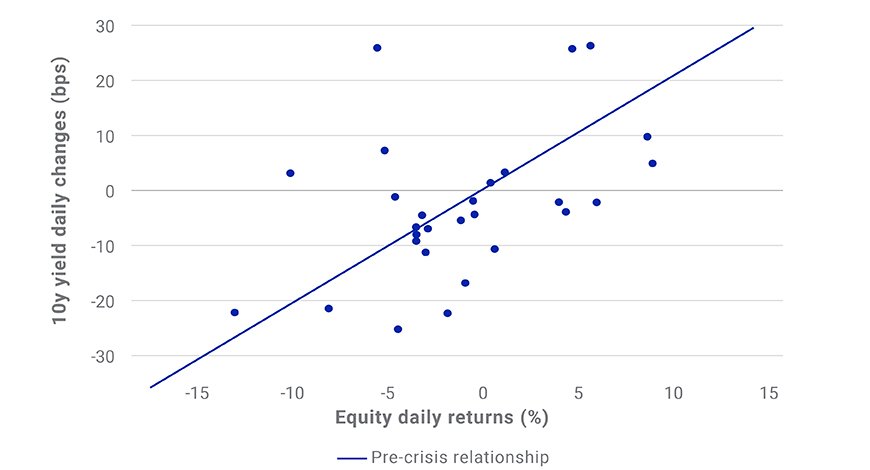
Against this backdrop, the rising yields between March 10 and 18 actually brought them closer to the expectation implied by equity-market returns. For the whole crisis period, the change in yields has been close to — and slightly exceeded — these expectations. And as the exhibit below shows, the rates-equity relationship has actually also been stable over shorter timescales. The volatility of each has been exceptional, but their daily correlation has held strong.
Equity and rates have maintained or strengthened their historical correlation

The daily returns of the MSCI USA Index and changes in the 10-year Treasury yield between Feb. 19 and March 27, 2020, maintained a similar relationship before the COVID-19 crisis. The correlation during this period was 44%, actually slightly stronger than its pre-crisis level of 36%, as estimated with the MSCI Multi-Asset Class Factor Model as of Feb. 19, 2020, with a 3-year half-life. Source: MSCI Multi-Asset Class Factor Model.
In a previous note, we explored a macroeconomic model that relates the rates-equity correlation to underlying drivers, most importantly the competing influences from inflation and sentiment shocks. At that time (last fall), the model suggested that the rates-equity correlation was very stable — and very far from the inflationary environment of previous decades, which would have flipped the sign. The events of recent weeks have been unprecedented, but the flight-to-quality benefits of Treasurys in a downturn have held strong.
1 The equity-implied rates are defined — similar to a correlated stress test — using the long-horizon MSCI Multi-Asset Class Factor Model’s covariance matrix, as of Feb.19, 2020, to project the change in rates given the realized equity returns.
Further Reading
Are rates and equities losing their balance?
Is the bond-equity hedge slipping away?
Bonds and equities: still happy together?
