As the Chinese equity market has evolved, investors have faced new choices. They can continue with broad allocations to the emerging markets (EM), choose slightly narrower allocations to China and other specific EM countries or consider targeted investments within China through a variety of means. This could be through factor-based systematic strategies , which we explored in June 2018, or sector investing, which has provided diversification in developed markets. We found that China also had the three key attributes we’ve seen sector investors look for in their allocations:
- Low correlation – particularly between cyclical and defensive sectors
- Differences in fundamentals, such as earnings growth and dividend yield
- Geographic differences that reflect differences in firms’ sources of revenue
LOW CORRELATION AMONGST SECTORS
Below, we illustrate historical returns and volatilities of Chinese and U.S. sectors in the years since the 2008-2009 global financial crisis. There were some notable similarities (e.g., financials delivered lower returns and higher risk than the broad market in both countries) and differences (e.g., utilities underperformed in the U.S. but outperformed in China). However, the main takeaway from the exhibit is how different sectors in China reacted differently to market conditions – much like they did in the U.S., as well as other developed markets.
Sector Risk and Return (2010 – 2018)
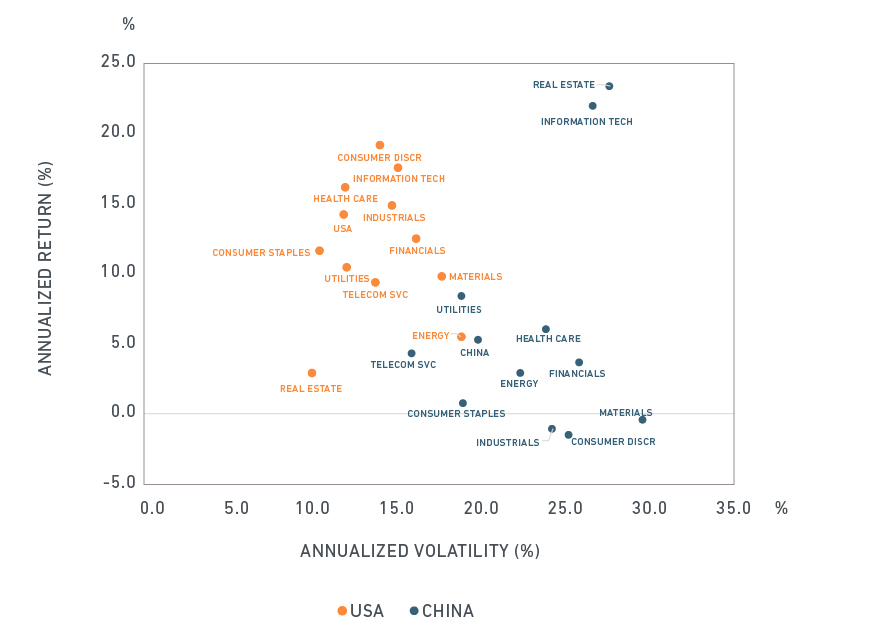
Returns are gross in USD from December 2009 through September 2018, except for real estate, which is from September 2016 to September 2018. Sector classification based MSCI GICS framework.
While past is (sometimes) prologue, it is certainly not the case here given the recent changes to the Global Industry Classification Standard (GICS®) framework.1 China is one of the countries most affected by the migration of firms between the communication services, information technology and consumer discretionary sectors. Major Chinese companies, such as Alibaba Group Holding Ltd., Tencent Holdings Limited and Baidu Inc. all found new homes.
Correlations between sectors based on the new classification are shown below for the U.S., emerging markets and China. We use MSCI’s USSLOW, EMM1 and ACH1 equity models, respectively. The exhibit provides two values for each region: correlation between all sectors, and correlation between traditionally defensive and cyclical sectors.
Pairwise Correlation Between Sectors
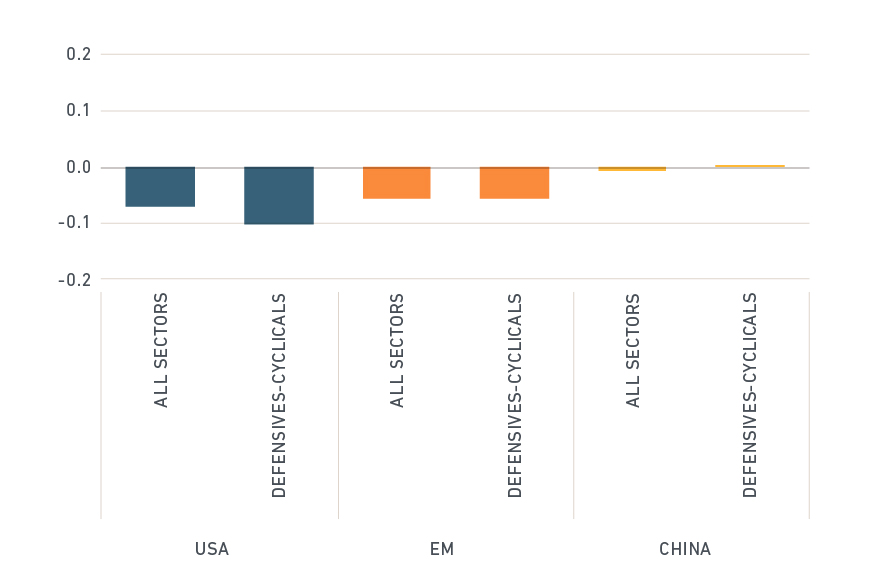
Correlations are active to parent benchmark using holdings as of September 2018. MSCI USSLOW, EMM1 and ACH1 equity risk models are used for the U.S., EM and China, respectively. Defensive sectors include Consumer Staples, Energy, Health Care and Utilities. Cyclical sectors include Communication Services, Consumer Discretionary, Financials, Industrials, Technology, Materials and Real Estate.
We observe that sector correlations within China were near zero, albeit slightly higher than in the U.S. or emerging markets. Importantly, the correlation between defensive and cyclical stocks was also low. Low correlations have led to diversification in other regions.
DIFFERENCES IN FUNDAMENTALS
One aspect unique to Chinese equities is the large number of state-owned enterprises (SOEs).2 By share of capitalization, the financials, energy, industrials and utilities sectors are largely state-owned, as shown in the next exhibit. This matters because China’s state-driven model can affect the fundamental profile of SOEs compared to privately owned enterprises.
Share of State-Owned-Enterprises
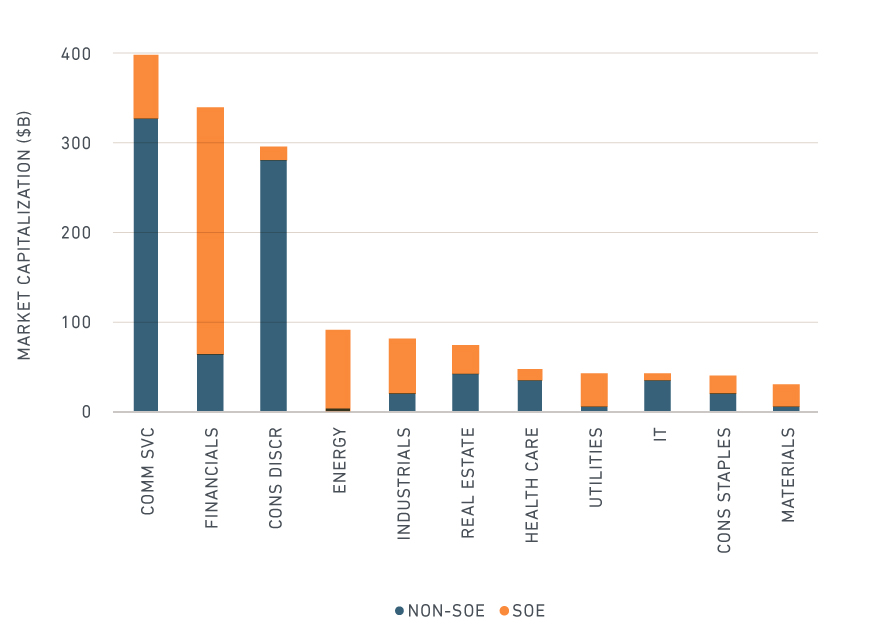
Market capitalizations are as of September 2018.
In particular, as of September 2018, SOEs had higher profitability, paid more of their earnings out as dividends and had lower stock-level volatility, but they also had poorer growth prospects than their private counterparts.
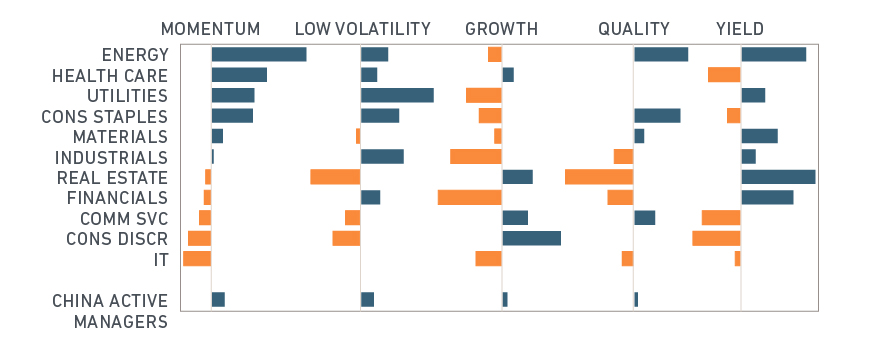
We complete the fundamentals picture by showing the differences in factors exposure between the sectors using the MSCI FaCS framework.3 The exhibit below displays relative values: blue bars indicate a value higher than the broad market, as represented by the MSCI China Index; yellow bars indicate a value lower than the market. For comparison’s sake, we also show an asset-weighted composite of mutual funds with a China regional focus.
Factor Exposure
Note that low size, liquidity and value FaCS exposures are not shown. FaCS exposures are as of September 2018, and relative to the MSCI China Index. “China Active Managers” represents an asset-weighted composite of funds from MSCI Peer Analytics with a Lipper Global Class of “China” and “Greater China” and assets under management greater than $25M as of September 2018. Sixty funds met these criteria.
Scanning down the momentum column, we observe that investors had recently fled the technology and consumer discretionary sectors into the relative safety of energy and utilities. That is, the sectors with lower volatility also had the highest momentum. These sectors also tended to have more state-owned firms, with higher exposure to the quality and yield factors -- albeit without the glowing growth prospects (as discussed above).
GEOGRAPHIC DIFFERENCES
Finally, we look at where companies derived revenue. Some investors in China have been increasingly focused on firms they believe will benefit from domestic consumption based on economic exposure. The exhibit below shows different sectors’ economic exposure to the U.S. and China, relative to the MSCI China Index. Once again we also show an asset-weighted composite of mutual funds with a China regional focus.
Economic Exposure
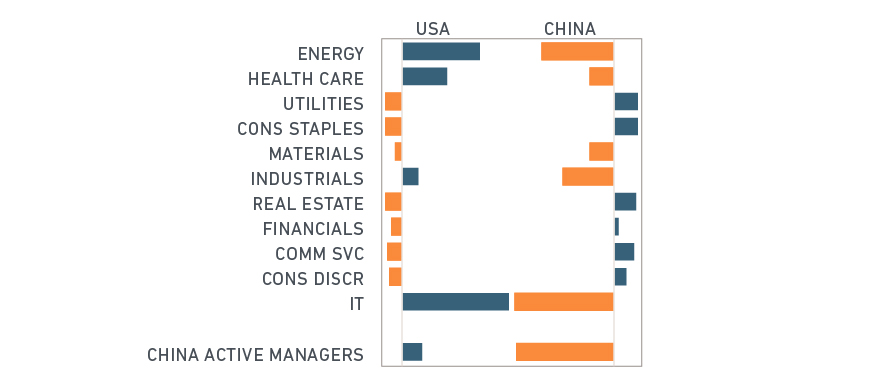
Economic exposures are as of September 2018 and relative to the MSCI China Index. “China Active Managers” represents an asset-weighted composite of funds from MSCI Peer Analytics with a Lipper Global Class of “China” and “Greater China” and assets under management greater than $25M as of September 2018. Sixty funds met these criteria.
Two clusters emerged: utilities, consumer staples, consumer discretionary, real estate, financials and communication services tended to be more domestically-oriented compared to the remaining sectors. Also of note is that active managers, in the aggregate, tended to hold firms that had relatively lower revenues from China. While not shown, these managers had an overweight to technology and health care.
SECTOR INVESTING HEADS EAST?
Sector investing has gained wide traction in developed markets, notably in the U.S. While it should be noted that Chinese sectors face concentration risks from mega-cap stocks, such as Alibaba, we found they had low correlation, differences in fundamentals and geographic differences – the three key attributes active and indexed sector investors have historically looked for in their allocations.
The author thanks Raman Aylur Subramanian for his contributions to this post.
1 GICS, the global industry classification standard jointly developed by MSCI and Standard & Poor’s.
2 SOEs are defined as 1) companies whose largest shareholder is a government entity and the total government holding is greater than 5%, 2) the government is the largest shareholder group and the total government holding is greater than 10% or 3) the total government holding is greater than 20%.
3 FaCS measures the degree to which a company or portfolio tilts, or is “exposed,” to factors that have been shown to be important drivers of portfolio risk and return.
Further Reading
Can your investment strategy work with China A shares?
Vive la Différence: Active factor strategies in China A shares

