- Historically, high beta between mortgage rates and Treasury yields indicated the MBS market may expect another round of significant quantitative easing.
- We’ve seen this belief reflected in significantly longer TBA durations. When this expectation faded, TBA durations shortened significantly.
- Regardless, MBS investors and risk managers may seek to take these uncertainties into account.
When the Federal Reserve announced its first rate cut in over a decade, they also said they would end the tapering of their quantitative easing (QE) program in August 2019, two months earlier than planned.1 However, they neglected to address the elephant in the room: Will the Fed resume its bond-buying program? This question weighs heavily on many investors’ minds, especially as the European Central Bank prepares for a second wave of QE this autumn.
Despite the Fed’s silence, the mortgage-backed securities (MBS) to-be-announced (TBA) market may be indicating that a new round of MBS purchases is coming. This, in turn, has led to significant lengthening of durations for the TBA coupon stack. In such an environment, MBS investors and risk managers have an additional risk factor to consider.
Will the Fed reverse course?
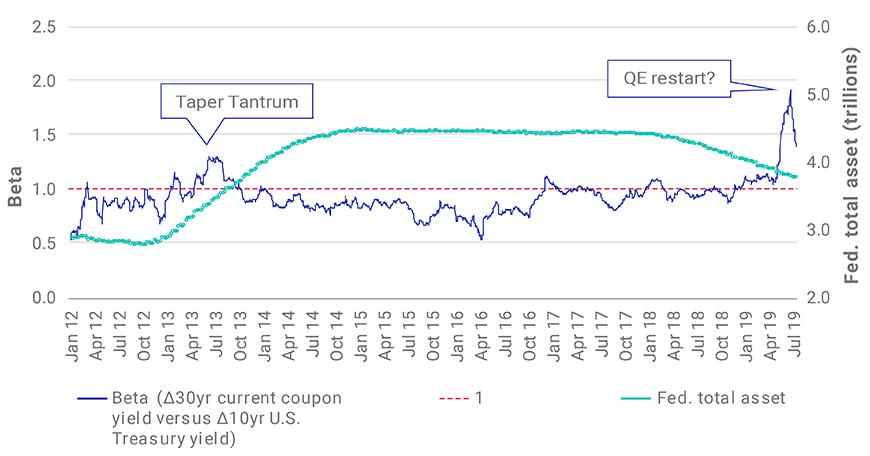
The U.S. MBS market seems to believe a significant resumption of QE, what we’re calling the “QE restart?” is coming. The exhibit below shows the 40-day (centered on the displayed date) regression beta between daily changes of the 30-year current coupon yield (CC), the bond equivalent yield for a hypothetical par TBA2 and the yield on a 10-year Treasury. This value, which has typically hovered around one, reached the historically high value of two, recently. Previous QE programs brought the Fed’s balance sheet to USD 4.5 trillion at its peak, with USD 1.8 trillion of that in agency MBS. The size, along with market perception, make it one of the major drivers of MBS basis.
In a QE resumption scenario, the Fed’s purchases of Treasurys and MBS, have historically driven Treasury rallies and MBS outperformance. (Conversely, in a tapering scenario, the lack of security purchases by the Fed typically has resulted in Treasury sell-offs and MBS under-performance.) This common risk driver has led to high correlations between MBS basis and Treasury yield, and high beta between MBS yield and Treasurys.
We saw a similar dramatic rise in the beta between CC and Treasury yield during the second half of 2013. This was the infamous “Taper Tantrum,” when the market believed the Fed would soon significantly taper their QE purchase program.
A sharp rise in beta has previously indicated a belief of coming Fed moves

Speculation about Fed moves led to longer MBS TBA durations
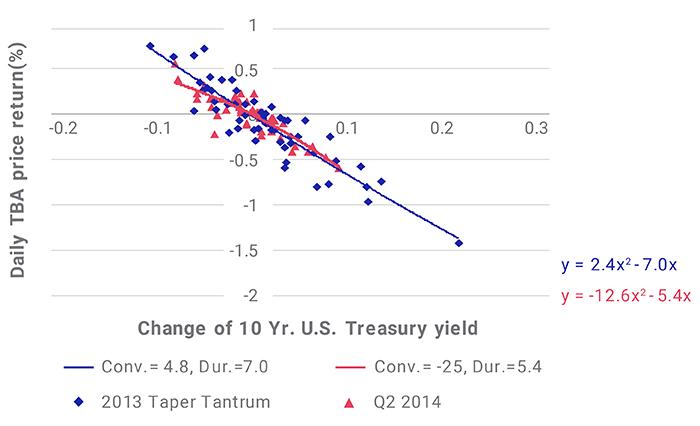
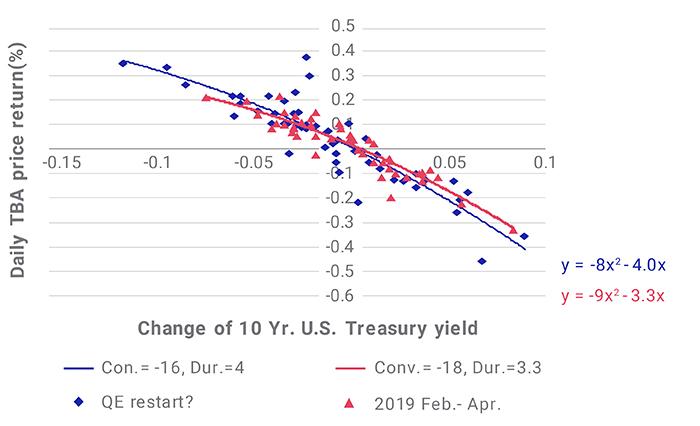
The high beta between mortgage and Treasury yields has historically led to significantly longer durations for the TBA stack. The exhibit below shows the regression relationships between daily TBA price returns and changes of the U.S. 10-year Treasury yield, by comparing the Taper Tantrum and QE restart? periods with control periods of correspondingly similar Treasury yield curve slopes.
The top panel contrasts Q2 2014 and the second half of 2013 (the Taper Tantrum), while the bottom focuses on the periods of February to April 2019 and May to July 2019 (the QE restart?). The regression showed higher durations and lesser negative convexity for the high beta Taper Tantrum and QE restart? periods.
QE restart? period showed durations and convexity patterns similar to the Taper Tantrum


The exhibit shows CUSP coupon TBA (around 50 bps in-the-money) returns versus. 10-year Treasury yield changes for Taper Tantrum and QE restart? periods versus control periods with similar curve slopes.
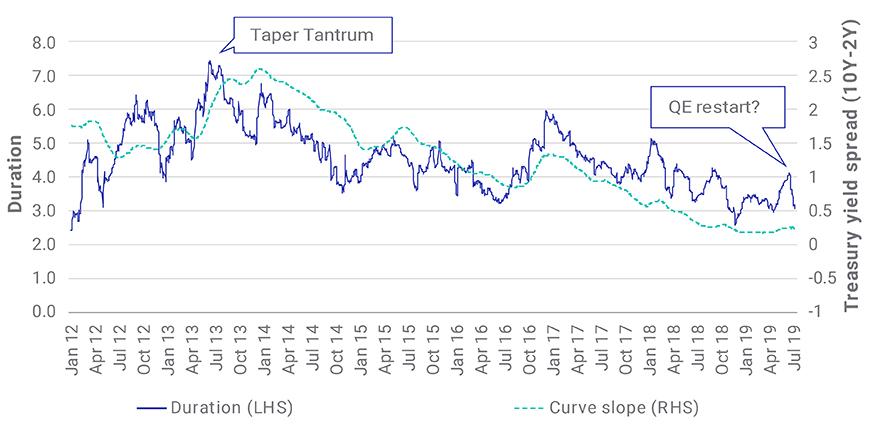
We interpolate the empirical durations of the coupon stack for the empirical duration of a constant 50 basis points (bps) in-the-money TBA, which, at around USD 103, made up the bulk of the Fed’s QE purchases. The exhibit below shows that the Taper Tantrum of 2013 lengthened durations about 1.5 years, while the QE restart? lengthened them by about 0.5 years. (These relatively lower durations were driven by current flat yield curves.)
Longer durations during QE restart? and Taper Tantrum periods

The exhibit shows duration of constant 50 bps in-the-money TBA and Treasury curve slope during the Fed’s quantitative easing and quantitative tightening cycles.
QE-induced duration lengthening adds complexity to MBS risk management
In retrospect, the QE tapering implied by the Taper Tantrum in 2013 proved premature by about four years. When taper worries subsided in 2014, the TBA durations dropped significantly. Similarly, if the new QE program does not materialize at the level the market appears to expect, similar dynamics may cause the TBA durations to shorten, all else being equal, potentially creating a “mis-hedging” situation for MBS.
Additionally, this issue may affect 30-year TBA production coupons, the expected sectors for QE purchase, much more than other MBS products, which creates further complexity in hedging MBS positions. In short, while the past is not always prologue, MBS investors and risk managers may want to pay close attention and stay focused on the numbers.
2 Zhang, D. and Zangari, P. 2017. “Getting ahead of the curve: How taper 2.0 may affect bond returns.” MSCI Research Insight.
Further Reading
A reality check for MBS duration risk
Getting Ahead of the Curve: How Taper 2.0 May Affect Bond Returns
Is MBS refinance risk increasing?
