- A heightened focus on biodiversity loss could lead to more stringent rules for how companies manage and report biodiversity risks.
- Geospatial analysis, as suggested by the Task Force on Nature-related Financial Disclosures, may help investors and companies assess region-specific biodiversity risks.
- 39% of MSCI ACWI Index constituents had assets in biodiversity-sensitive areas, with metals and mining companies representing a high share of assets in sensitive areas with limited practices to manage these risks.
A quarter of existing animal and plant species could face extinction over the next several decades,1 which could heighten the potential for significant economic risks from biodiversity loss. With more than half of global GDP (USD 44 trillion) being moderately or highly dependent on nature,2 investors, governments and other stakeholders are increasingly putting biodiversity in the spotlight. The United Nations Biodiversity Conference in Kunming, China, scheduled for August, is set to discuss a draft biodiversity framework that may lead to more stringent national disclosure rules for companies, which could impact how investors assess and manage biodiversity risk.
LEAP before you look
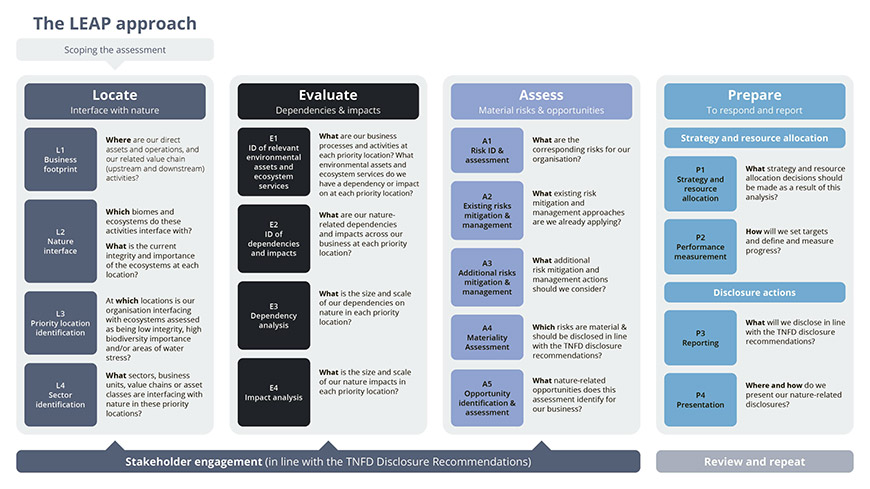
Despite these developments, there is no generally accepted way for issuers and investors to assess and report on nature-related risks. To close this gap, The Task Force on Nature-related Financial Disclosures (TNFD) aims to create a dedicated framework by September 2023 that includes disclosure recommendations and practical guidance on how to assess and incorporate biodiversity risks and opportunities.3 Their LEAP approach suggests four assessment phases: Locate a company’s interface with nature; evaluate its dependencies and impacts; assess related risks and opportunities; and prepare to respond and report to investors (shown below).

Source: Task Force on Nature-related Financial Disclosures
The LEAP approach relies heavily on location data, highlighting the fact that biodiversity impacts vary depending on whether company operations are situated in an urban area, a coastal zone or a tropical rainforest. Therefore, investors and companies may want to better understand where operations and supply chains are located to identify and manage nature-related risks.
Pinpointing location in our analysis
We used geospatial analysis and the MSCI Asset Location Database to identify the constituents of the MSCI ACWI Index that had physical assets in biodiversity-sensitive areas (shown below). To define an area as sensitive, we used the global, area-weighted mean for the Mean Species Abundance (MSA) metric for 2015, which is a proxy for local biodiversity intactness.[1] Biodiversity-sensitive areas are intact ecosystems with minimal species loss that are recognized as important areas for conservation efforts and are more sensitive to biodiversity-loss impacts.
Industries with operations in biodiversity-sensitive areas

Data as of April 6, 2022. The “Mean Species Abundance” (MSA) metric indicates the local biodiversity intactness and is derived using the Global Biodiversity Model for Policy Support (GLOBIO). The GLOBIO model calculates local terrestrial biodiversity intactness by assessing anthropogenic pressures on the environment. MSA ranges from 0 (=all original species extinct) to 1 (fully intact environment) with 0.56 representing the global area-weighted mean for 2015 data as of April 12, 2022, with a total universe that includes the 2,850 constituents of MSCI ACWI Index. Schipper, Aafke, et al. “Projecting Terrestrial Biodiversity Intactness with GLOBIO 4.” PBL, Nov. 3, 2019. Source: GLOBIO, MSCI ESG Research
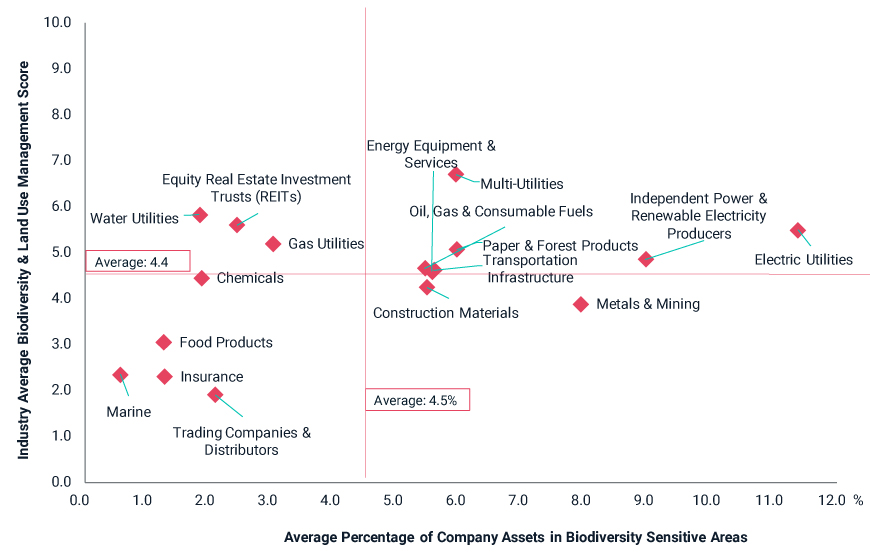
We found that 39% (1,103 companies) of index components had at least one asset (4,603 assets in total) located in a sensitive area with a high average share of assets across a diverse set of Global Industry Classification Standard (GICS®)5 industries.6 Proximity to sensitive areas could be reflected in upcoming reporting regulations and may be an impactful risk consideration for investors.
Varied risk management
The TNFD’s LEAP methodology pinpoints the need to assess a company’s risk management practices. The high-level view of risk management practices for industries located in biodiversity-sensitive areas is shown in the exhibit below.7 The risk management practices of utility companies were relatively robust, including policies and programs to reduce the adverse impacts on nature. In contrast, the metals and mining industry had a relatively high share of assets in sensitive areas, as well as relatively weak management practices leaving them more exposed to future regulations and stakeholder pressure.
Risk management in biodiversity-sensitive areas

We considered an asset in an area with a MSA value above the global average of 0.56 is considered to be in a location that is more sensitive to adverse impacts. Total universe includes the 2,850 constituents of the MSCI ACWI Index. The “Biodiversity & Land Use Risk Management Score” is based on indicators such as policies, programs to address adverse biodiversity impacts and involvement in related controversies. 0 = lowest risk management capacity, 10 = highest. Sources: MSCI ESG Research, GLOBIO
Ahead of the curve
Early adoption of the TNFD framework is one way that companies are working to counteract increasing pressure from regulators and other stakeholders to identify, report and manage their exposure to biodiversity risks. Investors and issuers maintaining a proactive stance by focusing on asset location and dedicated risk management practices could help them work to alleviate some of these challenges.
1"The Global Assessment Report on Biodiversity and Ecosystem Services." Intergovernmental Science-Policy Platform on Biodiversity and Ecosystem Services, May 6, 2019.
2"Half of World’s GDP Moderately or Highly Dependent on Nature, Says New Report." World Economic Forum, Jan. 19, 2020.
3“The TNFD Nature-Related Risk & Opportunity Management and Disclosure Framework Beta v0.1.” Task Force on Nature-related Financial Disclosures, March 15, 2022.
4The Mean Species Abundance (MSA) metric indicates the local biodiversity intactness and is derived using the Global Biodiversity Model for Policy Support (GLOBIO). The GLOBIO model that calculates local terrestrial biodiversity intactness by assessing anthropogenic pressures on the environment. MSA ranges from 0 (=all original species extinct) to 1 (fully intact environment) with 0.56 representing the global area-weighted mean for 2015.
5GICS is the global industry classification standard jointly developed by MSCI and S&P Global Market Intelligence.
6These included electrical utilities, mortgage real estate investment trusts, independent power & renewable electricity producers, metals and mining, paper and forest products, multi-utilities and transportation infrastructure.
7Risk management practices could include deforestation policies, measurable targets to lower biodiversity impacts or programs to enhance sustainable certification in the supply chain.
Further Reading
Understanding the Biodiversity Crisis. How the Loss of Biodiversity Affects Investors and how to Assess Related Impacts and Risks (Client access only)
Mining’s Impact on Biodiversity: A Rising Risk
Is the Food Industry Ready for Kunming? The Short Answer Is No
Climate and Net-Zero Solutions - MSCI
