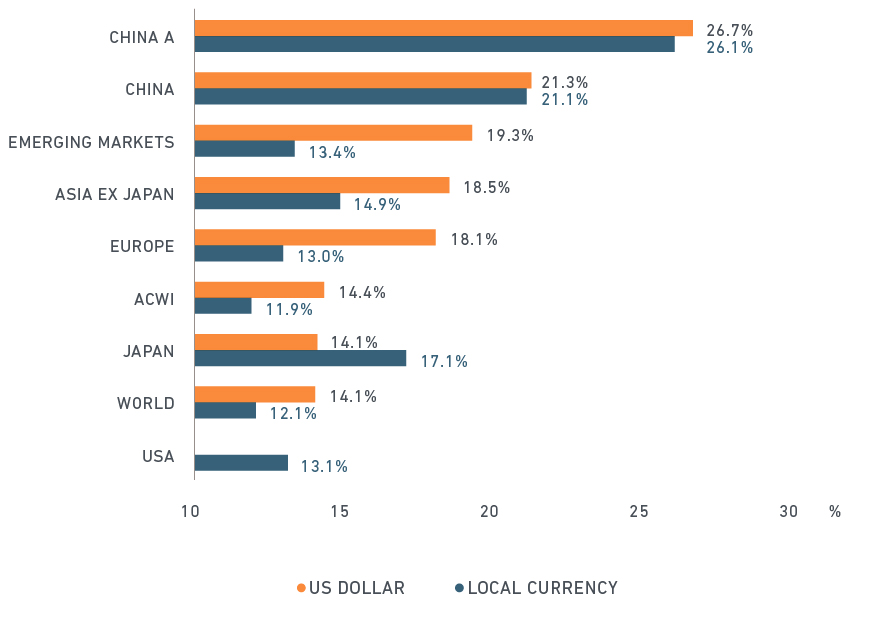
Since we added China A shares to the MSCI Emerging Markets Index in May and August 2018, global investors have educated themselves on these stocks, and may be starting to evaluate how different factors have performed historically in this market. Specifically, what has been the effect of China’s relatively high market annualized volatility — 26.1% in local currency terms from November 2008 to August 2018?1 That was more than double the 11.9% volatility experienced by the MSCI ACWI Index, as we can see in the exhibit below.
Was this too much short- to medium-downside risk for investors to bear as they sought a return premium from potential long-term growth in China? Have any factors shown reduced risk historically with enhanced returns? While not indicative of future performance, we found that a hypothetical portfolio based on the minimum volatility factor (as proxied by the MSCI China A Minimum Volatility Index) exhibited both performance characteristics during our study period.2
Annualized volatility of China A shares versus other major markets

Based on monthly returns from November 2008 to August 2018
Historical outperformance with less risk
The minimum volatility factor has historically identified global markets with below-average volatility and has been embraced by global institutional investors in active and indexed strategies.3
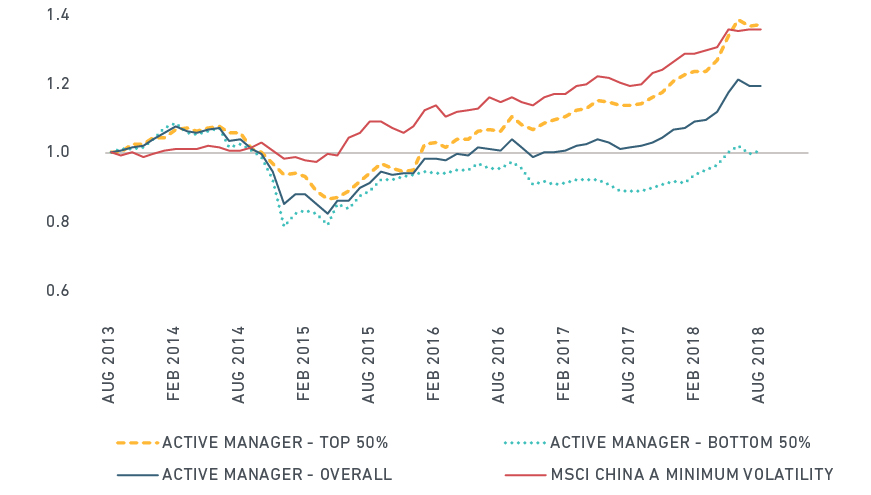
In the China A shares market, we see in the exhibit below that minimum volatility has produced strong cumulative relative returns over the past five years. On an annualized basis, while active China A managers outperformed the MSCI China A Index by 3.9% per year from August 2013 to August 2018, the hypothetical portfolio replicating the MSCI China A Minimum Volatility Index outperformed that benchmark by 6.7% per year, and outperformed 70% of active managers in the sample.4
China A managers and China A Minimum Volatility Index returns vs. MSCI China A Index

Source: Lipper, MSCI Research. From the Lipper database, we selected active equity funds with a focus on the China A market and at least a 5-year track record as of Aug. 31, 2018: 29 funds were identified. Aggregate portfolios of active managers were then asset weighted and rebalanced monthly.
Over a 10-year period, from November 2008 to August 2018, the MSCI China A Minimum Volatility Index outperformed the MSCI China A Index by 4.9% per year and exhibited a risk reduction of 4.1 percentage points per year. The exhibit below shows that the pattern of performance enhancement and risk reduction held for every three-year period from November 2008 to August 2018.5
Rolling three-year performance and volatility of MSCI China A Minimum Volatility Index

Why did minimum volatility outperform during this period?
There are four observations that may help explain the historical return premium we observed:
- Market rallies in China A shares over the past decade were short lived and followed by sizable drawdowns. The minimum volatility approach may have helped mitigate downside risk during such downturns.
- Behavioral biases of Chinese retail investors led to them frequently trading in and out of “star stocks.” High volatility of these stocks often coincided with their subsequent underperformance.
- Some active fund managers in China may have over-traded high volatility stocks. The hypothetical minimum volatility portfolio avoided this.
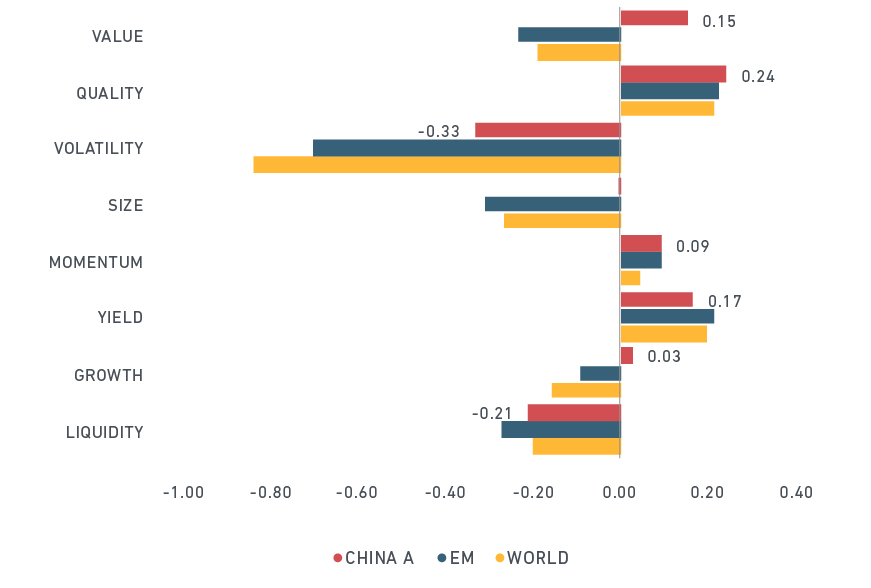
- On average, the MSCI China A Minimum Volatility Index historically has been tilted towards stocks featuring cheaper valuation, higher dividend yield and stronger fundamental quality (see exhibit below). These factor characteristics contributed to the outperformance during our sample period.6
Average FaCS exposure of minimum volatility indexes

Calculation is based on monthly factor exposures from November 2008 to August 2018. MSCI FaCS is a standard method for evaluating and reporting the factor characteristics of equity portfolios. It consists of eight factor groups that have been extensively documented in academic literature and validated by MSCI Research as key drivers of risk and return and are constructed by aggregating 16 factors from the latest Barra global equity factor risk model, GEMLT.
While minimum volatility approaches in developed and emerging markets were tilted towards more expensive stocks and those of smaller companies on average, the minimum volatility approach in China A shares studied here had a positive value bias and no significant size exposure. Understanding and exploiting nuances of these factor exposures may help investors better manage their China A strategies, including minimum volatility portfolios.
1 Shanghai Stock Exchange Annual Report. (2015, 2016, 2017).This high volatility is related to the short-term risk-seeking behavior of the Chinese retail investors who contributed to high market turnover in China A shares. Retail individual investors, with more than 99% of stock trading accounts in China, contributed to most of the active trading activities in China. For instance, individual investors made up 87%, 86% and 82% of stock trading values in 2015, 2016 and 2017, respectively. Source: Shanghai Stock Exchange.
2 This report contains analysis of historical data, which includes hypothetical, backtested or simulated performance results. There are frequently material differences between backtested or simulated performance results and actual results subsequently achieved by any investment strategy. Past performance — whether actual, backtested or simulated — is no indication or guarantee of future performance. None of the information or analysis herein is intended to constitute investment advice or a recommendation to make (or refrain from making) any kind of investment decision or asset allocation and should not be relied on as such.
3 Alighanbari, M., S. Doole, L. Mrig and D. Shankar. (2016). “Constructing low volatility strategies.” MSCI Research Insight. For more information on the index, see the MSCI Minimum Volatility Index Methodology and related research materials.
4 If one takes survivorship bias in the fund screening process into consideration, the likelihood of outperformance could be even higher.
5 Minimum Volatility approaches simulated on the MSCI China A International Index and MSCI China A Onshore Index delivered similar enhanced return/risk characteristics.
6 Bonne, G. (2018). “Creating a Common Language for Factor Investing.” MSCI Research Insight.
Further Reading:
Can your investment strategy work with China A shares?
Are You Ready for China A Shares?
