- Transition to a low-carbon economy could lead to “greenflation” — i.e., an increase in inflation in the medium term due to rising energy prices, among other things.
- Greenflation, together with the increased investment demand to finance the transition, could push long-term bond yields up.
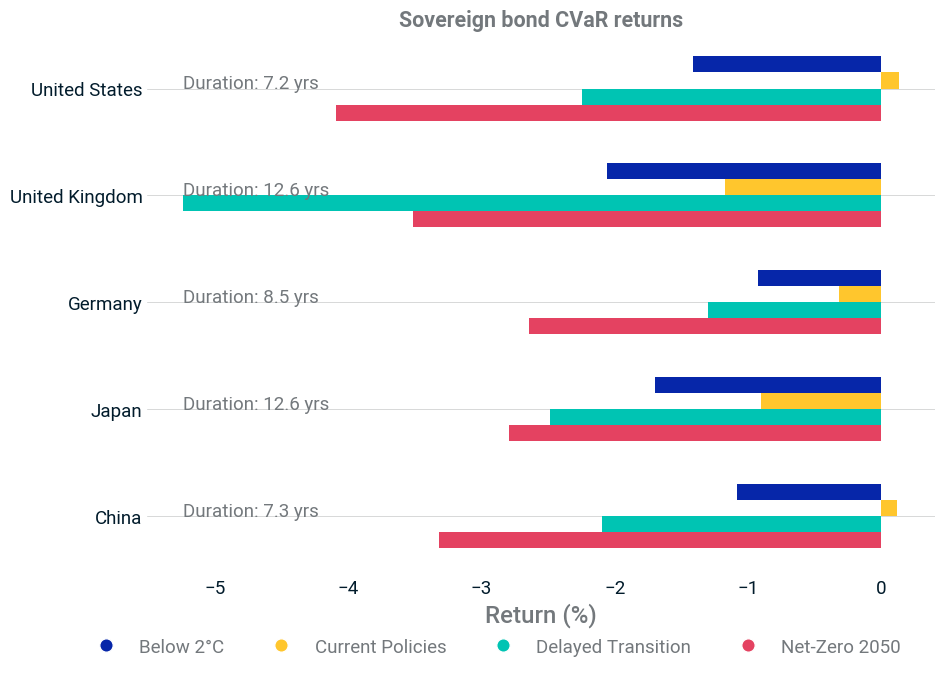
- If investors suddenly shifted their expectations from a climate-agnostic baseline to a “Net-Zero 2050” scenario, a U.S. sovereign-bond portfolio's value could drop by approximately 4%.
A transition to a low-carbon economy could trigger an increase in inflation in the medium term due to rising energy prices — generally known as “greenflation.”1 In addition to these inflationary pressures, the increased investment demand that the energy transition would require could raise real interest rates. Both these evolutions could put upward pressure on long-term interest rates, which, in turn, could lead to a downward repricing of fixed-income portfolios.
Investigating climate-change scenarios’ impact on inflation and interest rates
The Network for Greening the Financial System (NGFS), a global network of central banks and supervisory authorities advocating a more sustainable financial system, developed a range of climate-change scenarios that capture these phenomena and project inflation and interest rates for the next 30 years (among other macroeconomic and climate variables).2
The exhibit below illustrates, for various climate-change scenarios, how much higher the U.S. inflation rate is projected to be compared to a climate-agnostic baseline scenario. For example, in the “Net-Zero 2050” scenario (red line), U.S. inflation runs higher initially and then declines steadily. Generally, in the green-transition scenarios modeled by the NGFS, inflation is expected to be higher than in the climate-agnostic baseline scenario for a period, although the timing might be different: For the “Delayed Transition” (green line), the increase in inflation occurs later than for the “Net-Zero 2050” scenario.
Inflation increase vs. climate-agnostic baseline
Source: Network for Greening the Financial System
The inflation assumption above, as well as other drivers (such as increased investment demand), feeds into the short- and long-term interest-rate projections in the NGFS scenarios. Based on these projections, we assessed how much different countries’ sovereign-bond yields could move if investors’ expectations shifted from a climate-agnostic baseline scenario to alternative climate-transition scenarios.3
For the “Net-Zero 2050” scenario, most countries in our analysis experience a significant jump in the short end of the yield curve. For example, if U.S. investors were to suddenly adjust their expectations from a climate-agnostic to the “Net-Zero 2050” scenario, we estimate that the yield curve could be shocked with upward spikes of approximately 85 basis points (bps) at the short end of the curve and 40 to 50 bps at the longer end (see the red line in the exhibit below). In contrast, for the “Delayed Transition” scenario (green), yields at the long end could increase more, consistent with the later timing of the inflation spike.
Transition scenarios’ yield-curve shock relative to climate-agnostic baseline scenario
Yield-curve shock when repricing from a climate-agnostic baseline scenario to a specific climate-change scenario. Source: Network for Greening the Financial System, MSCI
The exhibit below shows our estimates of how the above yield shocks could impact the value of sovereign-bond portfolios for select countries. As the average duration of the U.S. sovereign-bond portfolio is around seven years, the “Net-Zero 2050” scenario leads to the largest instantaneous repricing, with a 4% loss for that portfolio. The U.K. sovereign-bond portfolio, with an average duration of 13 years, contains more longer-dated bonds, which are more significantly impacted under the “Delayed Transition” scenario. Hence, the largest losses were experienced under that latter scenario.4
The scenarios’ impact on sovereign-bond portfolios
 Instantaneous profit and loss for select countries’ sovereign-bond portfolios under a repricing from a climate-agnostic to a climate transition scenario. Each country’s portfolio is represented by the relevant Markit iBoxx sovereign-bond index. The duration of each country’s portfolio is also displayed on the chart. Based on market data as of Jan. 7, 2022. Source: Network for Greening the Financial System, IHS Markit, MSCI
Although the European Central Bank says a green transition would be less damaging than the cost of the physical impact of climate change,5 investors may wish to gauge the potential green-transition scenarios for inflation and interest rates and their impact on bonds exposed to those risk factors. Under the NGFS’s “Net-Zero 2050” scenario, this could amount to a 4% instantaneous loss for a U.S. government-bond portfolio.
1Schnabel, Isabel. “Looking through higher energy prices? Monetary policy and the green transition.” European Central Bank, Jan. 8, 2022.
2The NGFS scenarios focus on a few important themes in the green transition, such as “a rapid decarbonization of electricity, increasing electrification, more efficient uses of resources, and a spectrum of new technologies to tackle remaining hard-to-abate emissions.” See: “NGFS Climate Scenarios for central banks and supervisors.” Network for Greening the Financial System, June 2021.
3For this analysis, we used the newly developed MSCI Sovereign Bond Climate Value-at-Risk methodology. We used the one- and 10-year interest-rate projections from the NGFS and backed out the implied yield curve as of today, consistent with the projections for each scenario (including a climate-agnostic baseline scenario). We then computed the shock on the yield curve by taking the difference between a climate-transition scenario’s implied yield curve and the baseline scenario’s yield curve. Next, we applied the yield-curve shock to a government-bond portfolio as a stress test. Note that the stress-test repricing occurs between two theoretical NGFS scenarios, not between the current yield curve and a climate scenario. For that reason — consistent with the MSCI Climate Value-at-Risk Model for corporate bonds — this profit-and-loss model does not consider how markets may have already priced in some of the climate risk. Furthermore, the NGFS’s macroeconomic modeling incorporates the impact of the transition as well as the impact of chronic weather changes to a country’s productivity. At this point, it does not include the impact of extreme weather events.
4Because of the impact of portfolio duration on profit and loss (P&L), one should be careful comparing different countries based on P&L. For example, the U.K. portfolio suffers more than twice as much as the U.S. portfolio under the “Delayed Transition” scenario. The yield shocks shown in the second exhibit, however, are comparable for both countries. Hence, the difference is mostly driven by the bonds’ maturities in the respective portfolios.
5Alogoskoufis, Spyros, et al. “ECB economy-wide climate stress test.” European Central Bank, Sept. 22, 2021.
Further Reading
Stress Testing Portfolios for Climate-Change Risk
