- In the face of rising temperatures in China, comprehensive adaptation and response plans are crucial to mitigate the physical risks of extreme heat, especially for more exposed regions.
- Under a 1.5°C warming scenario, the energy and utilities sectors have higher average potential losses, while under a more extreme scenario of 5°C, financials, real estate and utilities are projected to be more sensitive.
- Among all physical climate risks, extreme heat accounted for 49% of the total potential losses in our hypothetical portfolio, second only to coastal flooding.
Last year, China suffered its most intense heatwave, with nearly one billion people experiencing temperatures exceeding 35°C.1 This year, the China Meteorological Administration has warned that more extreme weather conditions may occur. With climate change accelerating, extreme and abnormal weather patterns are becoming more frequent, raising questions for investors around potential company and sector impacts.
Which sectors may be most at risk to heatwaves?
According to the latest report from the Intergovernmental Panel on Climate Change (IPCC), the average global surface temperature for 2011–2020 was 1.1°C above 1850–1900 levels. And as global temperatures continue to rise, further changes in weather and climate extremes are projected, resulting in escalating damages.2 For China specifically, more than one quarter of the country is expected to face medium-to-high or high risk from physical climate impacts under a 2°C warming scenario.3
While overall exposure to physical climate risk is anticipated to increase for companies operating in China, sector-level impacts are not projected to be evenly distributed. To assess this, we took a hypothetical portfolio of companies, based on the MSCI China Index (as of March 2023), and determined variations in physical climate risk using MSCI’s Climate Value-at-Risk (VaR) model.4
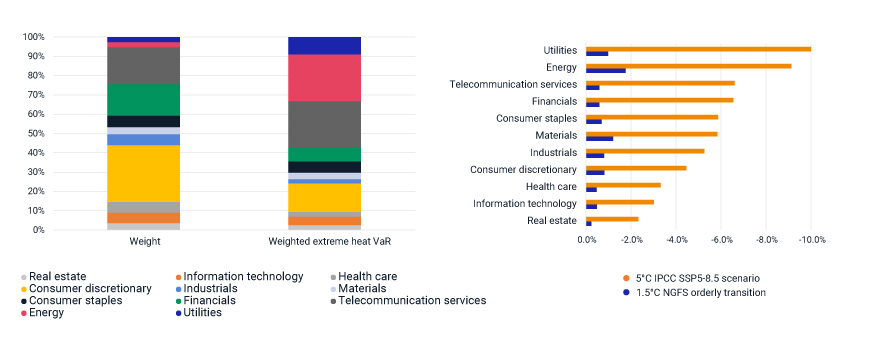
We found that extreme heat comprised 49% of the total potential loss from all physical climate risks in the hypothetical portfolio, the second largest hazard type following coastal flooding. The exhibit below presents the potential losses from extreme heat for each Global Industry Classification Standard (GICS®)5 sector on a 1.5°C warming trajectory.6
Potential losses from extreme heat varied considerably by sector

Data shown for the selected hypothetical portfolio based on constituents of the MSCI China Index. Selected climate scenarios are the 1.5°C Network for Greening the Financial System (NGFS) orderly transition for the left-hand exhibit and we add the 5°C IPCC SSP5-8.5 scenario for comparison for the right-hand exhibit. Due to data availability, the MSCI Climate VaR model only has 84.27% coverage under extreme heat. All analysis is based on this coverage scope. Data as of March 27, 2023. Source: MSCI ESG Research
For the hypothetical portfolio, the energy and utilities sectors, with a combined 5% weighting, contributed 33% of the weighted extreme heat VaR, partly due to infrastructure disruptions, increased cooling costs and reduced productivity. By contrast, the consumer discretionary and financials sectors, with a combined weighting of 44%, contributed a much lower potential loss percentage (22%).
Not only does the extent of vulnerability differ across sectors, but the relative impacts each sector experiences are shown to change under different warming scenarios. Financials, telecommunication services and real estate, which may not be largely affected under an orderly 1.5°C transition, become some of the most sensitive to global warming with projected market value losses increasing ten-fold under a 5°C warming scenario compared to a 1.5°C warming scenario (right-hand side of the exhibit above).
Where might a heatwave hit the hardest?
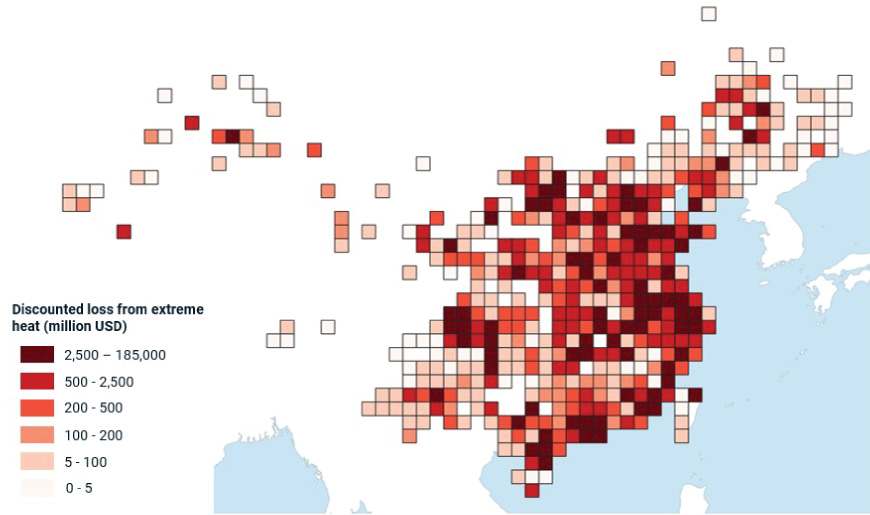
Another factor at play in economic losses due to extreme heat is location. To look at this, we retrieved the asset-level assessments of extreme-heat VaR and then aggregated them to assess worst-case potential losses (i.e., a 5°C warming scenario).
Potential losses from extreme heat are projected to vary by location

Data shown for the selected sample portfolio based on constituents of the MSCI China Index under the 5°C IPCC SSP5-8.5 scenario. Numbers and color indicate potential discounted extreme-heat-related losses, based on the location of company assets, using MSCI’s physical Climate VaR model. Each square represents 1° longitude * 1° latitude. Data as of March 2023. Source: MSCI ESG Research
Under the 5°C warming scenario, we found companies domiciled in Beijing, Shanghai, Shenzhen and inland provinces such as Sichuan Province and Hebei Province are exposed to higher potential losses (dark red regions in the above exhibit). Within these areas, the assets located in the same single grid (smaller than 10,000km2) may face a combined potential loss over USD 2 billion by 2100.
Investors look to manage risk exposure to heatwaves
Given the potential losses from extreme heat, investors may be thinking about ways to reduce their portfolios’ risk exposure or comparing risk across different portfolios. We therefore constructed several other hypothetical portfolios based on constituents of the MSCI China All Share Index (Portfolio B), the MSCI China A 50 Connect Index (Portfolio C), the MSCI China Low Carbon Leaders Index (Portfolio D) and the MSCI China Climate Paris Aligned Index (Portfolio E), in addition to the hypothetical portfolio detailed above (Portfolio A). All are as of March 2023.
Extreme heat VaR comparison for hypothetical portfolios under a hot-house world (5°C) scenario

Data shown for the hypothetical portfolios A to E are based on constituents of MSCI China Index, MSCI China All Share Index, MSCI China A 50 Connect Index, MSCI China Low Carbon Leaders Index, and MSCI China Climate Paris Aligned Index, respectively. The selected climate scenario is 5°C IPCC SSP5-8.5. Data as of March 2023. Source: MSCI ESG Research
As shown above, the hypothetical portfolios that capture the large- and mid-cap representation of the Chinese market all face a relatively high extreme-heat VaR, echoing our analysis above which showed this risk’s potential to affect all sectors. We did find that Portfolio D, which is intended to have a low carbon-intensity relative to its benchmark, also had lower risk from extreme heat, compared with the broader Portfolio A. However, this result may be a coincidence — lower emissions may not always correlate with lower physical climate risk. We found that the physical risk of a portfolio was ultimately affected by asset weighting, sector vulnerability to certain climate hazards and asset location distribution. Unsurprisingly, the lowest risk from extreme heat was noted for the Paris-aligned Portfolio E, where lowering this risk is an explicit objective.
Moving forward, investors may need to combine risk-management strategies that fully consider the sector variation and the comprehensive adaption and response plans in key spots to effectively address these growing risks from physical climate change.
1Smriti Mallapaty. “China’s extreme weather challenges scientists trying to study it.” Nature, Sept. 21, 2022.
2“AR6 Synthesis Report: Climate Change 2023.” IPCC, 2023.
3Shaohon Wu et al. “Identification of regional pattern of climate change risk in China under different global warming targets.” Journal of Geographical Sciences, March 2023.
4The MSCI Climate VaR model provides forward-looking impact metrics on transition and physical risks and opportunities. A total of 10 different climate hazards were assessed and translated into potential financial impacts based on the asset damage and business interruption in physical Climate VaR.
5GICS, the global industry classification standard jointly developed by MSCI and S&P Global Market Intelligence.
6In this research, we use the 1.5°C REMIND NGFS orderly transition and 5°C IPCC SSP5-8.5 transition pathways. Our model assumes a discounted factor applied to each asset’s revenue when the daily maximum heat exceeds 30°C and 35°C.
