- Systematic government-bond strategies tilted toward momentum have performed well year to date. As yields reached historic lows, markets with the largest gains became even more expensive, as reflected in the performance of MSCI’s rates momentum factor.
- Historically, momentum has had long periods of strong performance before falling sharply, so both bears and bulls could have reason for caution.
- The developed sovereign-bond markets with the largest positive momentum exposures are Australia, Israel and the U.S., while Japan, Switzerland and Norway have the most negative exposure.
Momentum strategies, which are based on the view that the trend in an asset’s returns will continue, have been employed by equity and commodity investors for decades.1 A growing body of literature suggests that the momentum effect exists in other asset classes — in developed-market sovereign rates, in particular.2 In this literature, trend-following strategies have produced consistent positive premia in bond markets, just as they have for equities and commodities, with lower overall levels of return and volatility
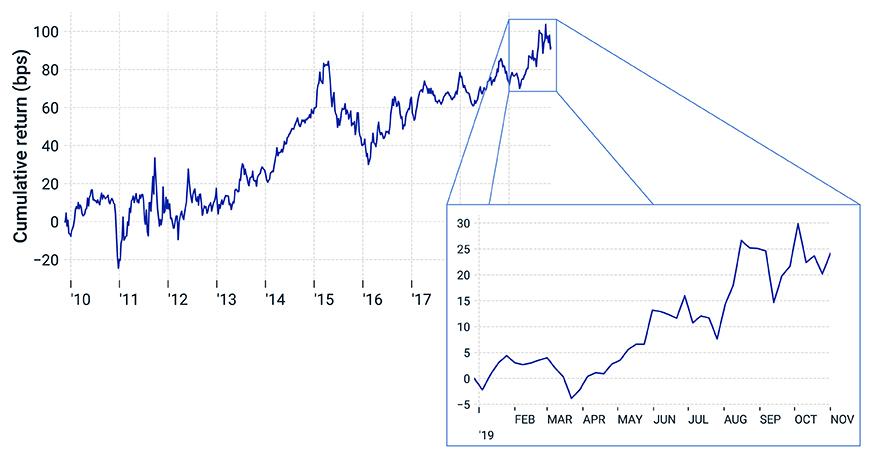
The rates momentum factor performed well over the last decade and year
At MSCI, we capture momentum in sovereign bonds in one of the suite of multi-asset-class systematic strategy factors built into the MSCI Multi-Asset Class (MAC) Factor Model.3 The rates momentum factor is a cross-sectional systematic factor based on a momentum signal defined by relative riskless bond returns net of the overall developed government-bond market on a currency-hedged, dollar-neutral basis.4 Since the beginning of 2019, the rates momentum factor performed well, as shown in the exhibit below, which displays the cumulative factor return in basis points (bps). In 2019, momentum was largely driven by the high relative strength of sovereign bonds in Australia and New Zealand, and the low relative strength in Norway and Hong Kong, coupled with strong gains in the U.S. and Israel.
Over the past decade, the factor has been a source of positive returns in general. The largest bond momentum-factor drawdown, from February 2015 through January 2016, came when a strong rally in the German and Swedish government-bond markets — which had driven their momentum exposures up — reversed. As with cross-sectional momentum strategies more generally, rapid reversals in high-relative-strength assets drove negative performance.
Rates momentum factor’s performance

While rates momentum has been a durable factor over the last decade, year-to-date performance has come amid a sustained, global bond-market rally, as seen in the following exhibit.
Sovereign curves rallied
Does the momentum factor have room to run?
Bond bulls may wish to be cautious when evaluating momentum. Given uncertainty around central banks’ rate cutting and U.S.-China trade negotiations, a reversal of current rate dynamics could happen rapidly, driving up rate volatility and having a potentially negative impact on the momentum factor. Indeed, in the same week as September’s sell-off in equity momentum, bond momentum experienced a reversal, driving the correlation between the two strategies to a multiyear high.5
For the moment, the big question with respect to curve momentum is: “How much lower can rates go?” In the exhibit below, we see that the Australia, Israel and (the ever-important) U.S. curves had the highest relative strength, while Japan, Norway and Switzerland had the lowest, as of Nov. 15, 2019. While cross-sectional momentum signal metrics don’t forecast market direction, momentum effects have historically been useful in understanding relative sovereign-bond returns during periods of lower rate volatility.
Global rates’ relative momentum strengths and weaknesses
Our analysis demonstrates that momentum can be an important factor in sovereign-rates markets. But conditions could change. Investors concerned with their exposures to short-term rate movements in global bond markets may wish to ask themselves whether the trend is, or is not, their friend.
1Jegadeesh, N. and Titman, S. “Returns to Buying Winners and Selling Losers: Implications for Stock Market Efficiency.” Journal of Finance, March 1993.
2Asness, C., Moskowitz, T.J., and Pedersen, L.H. “Value and Momentum Everywhere.” Journal of Finance, June 2013.
Bhansali, V., Davis, J., Dorsten, M.P., and Rennison, G. “Carry and Trend in Lots of Places.” Journal of Portfolio Management, March 18, 2015.
Geczy, C. and Samonov, M. “Two Centuries of Multi-Asset Momentum (Equities Bonds, Currencies, Commodities, Sectors and Stocks).” SSRN, May 11, 2017
3Shepard, P., DeMond, A., Xiao, L., Zhou, C., and Ahlport, J. 2018. “The MSCI Multi-Asset Class Factor Model.” MSCI Model Insight. Client access only.
4Specifically, cross-sectional strategies are long yield curves whose recent returns have been strong relative to the global developed-market average and short those curves with low relative strength. We define relative strength by comparing returns across markets in a one-year lagged by one-month window. This cross-sectional approach can be contrasted with a time-series momentum strategy in which long and short positions are taken based only on the recent return of the curve with no comparison to the overall market trend.
5See Virgaonkar, W. and Varsani, H. “Factors in Focus: Momentum hits a valuation speed bump.” MSCI Blog, Oct. 3, 2019.
Further Reading
Factors in Focus: Momentum hits a valuation speed bump
The MSCI Multi-Asset Class Factor Model (client access only)
