
- Growth strategies have performed well over the past few years. For investors, an important question is whether the recent performance is an anomaly.
- For a growth strategy that simply picks stocks with high growth characteristics, the recent outperformance is out of line with that type of growth strategy’s historical performance.
- For a strategy that targets the growth factor while controlling for other factors, the recent outperformance has been in line with its longer historical performance.
Growth strategies have outperformed value strategies in recent years. Is growth’s recent performance an anomaly when we look at it in a long-term context? The answer: It depends on what you mean by a growth strategy.
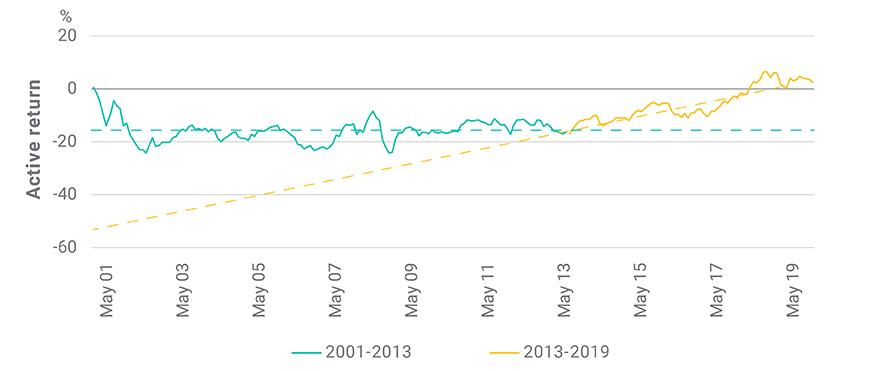
For a growth strategy that selects stocks with the highest level of growth characteristics, the answer is yes. The performance is an anomaly. This is illustrated in the exhibit below, where we show the performance of a hypothetical, simple growth portfolio that selects about 30% of the investment universe (defined here as the MSCI World Index) with the highest growth score1 on each quarterly rebalancing from May 2001 through August 2019. We fitted two lines to the performance of this strategy, the yellow line is based on returns of roughly the last six years, while the turquoise line is based on the 12 years before that. The contrast between the slopes of these two trend lines is clear. The performance for the period from 2001 to 2013 is almost flat, which means the strategy performed basically in line with its benchmark, the MSCI World Index. In contrast, the slope is positive for the more recent period (2013 to 2019), reflecting the strategy’s recent outperformance.
The simple growth strategy’s recent outperformance marked a change
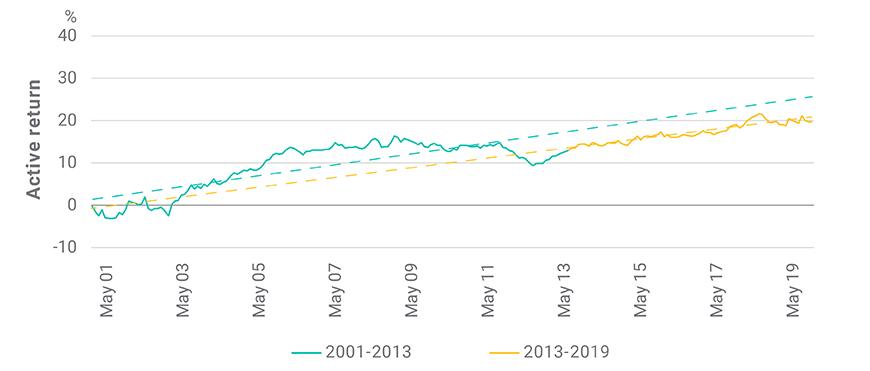
The story, however, is different when the strategy targets purer growth exposure by controlling exposure to non-growth style factors, such as value and volatility. The exhibit below shows the performance of a growth strategy in which the objective is to have the highest possible exposure to the growth factor while controlling non-growth style factors to within a range.2 The chart is also overlaid with trend lines for the two time periods discussed above. In this case, the slopes are similar for the two time periods, indicating that this growth strategy’s recent outperformance was in line with its longer-term historical performance.
The factor-controlled growth strategy’s recent outperformance continued the trend
Different levels of non-growth factors’ return contribution for different growth strategies
In “The growth-factor premium: Seeking a systematic approach for capturing it,” we compared the characteristics of a simple growth strategy with a factor-controlled one and discussed how exposure to non-growth factors have affected performance. Here, we highlight how controlling non-target factors in a growth strategy helped capture growth’s long-term premium.
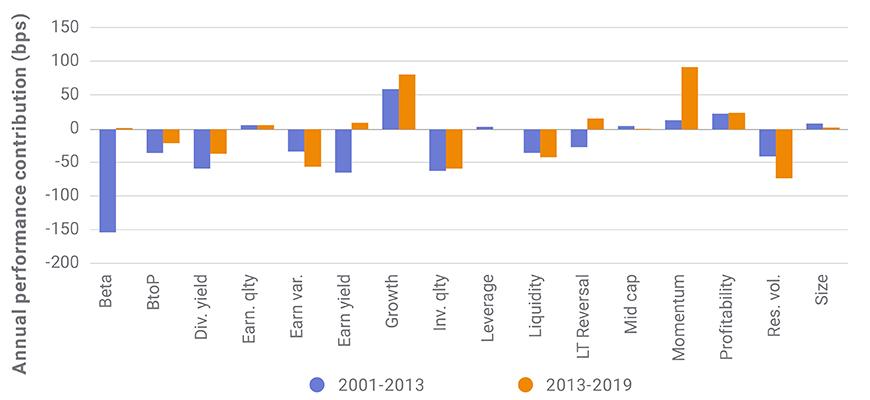
For the simple growth strategy, the growth factor had a similar contribution to return in both periods in our analysis, but exposure to non-target factors had very different levels of impact. Three factors to note on the exhibit below are beta (volatility), earnings yield (value) and momentum, which accounted roughly for a combined 300-basis-point (bp) difference between annual performance over the two periods.
Non-growth factors had large effect on a simple growth strategy
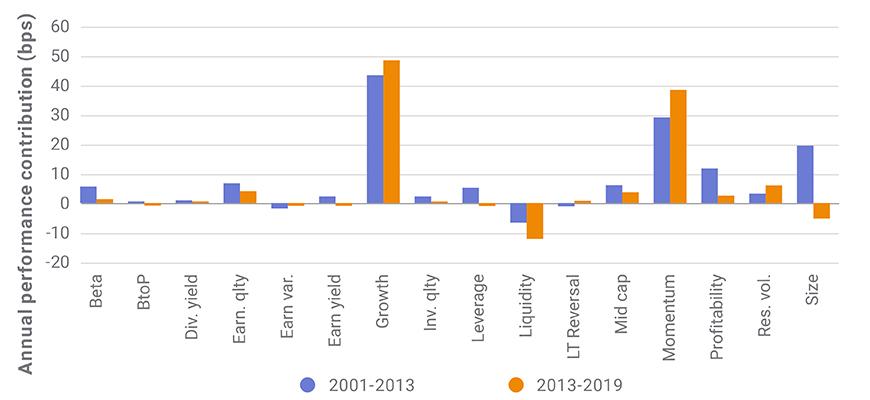
On the other hand, when exposure to non-growth factors was controlled, the return contribution from these factors was much more stable and muted over time, as shown in the exhibit below. In this case, growth remained the main contributor to the return and non-growth-factor contributions were similar across the two periods.
Non-growth factors had less effect on a factor-controlled growth strategy
Accounting for sector exposure
Sector exposures also affected the growth strategies’ performance. The exhibits below show the two growth strategies’ active exposure to the 11 Global Industry Classification Standard (GICS®)3 sectors, as well the active annual performance of each sector for the two periods used throughout our analysis.
For the more recent period (June 2013 through August 2019), the factor-controlled strategy showed limited exposure to sectors,4 while the simple growth strategy had significant active exposure to several sectors. One notable sector is information technology (IT), where the simple growth strategy had, on average, active exposure of about 14% over the period. IT outperformed the market by 9.1% over the period and therefore was a big contributor to the simple growth strategy’s outperformance.
Simple growth strategy benefited from large, but unintended, sector exposures in recent years
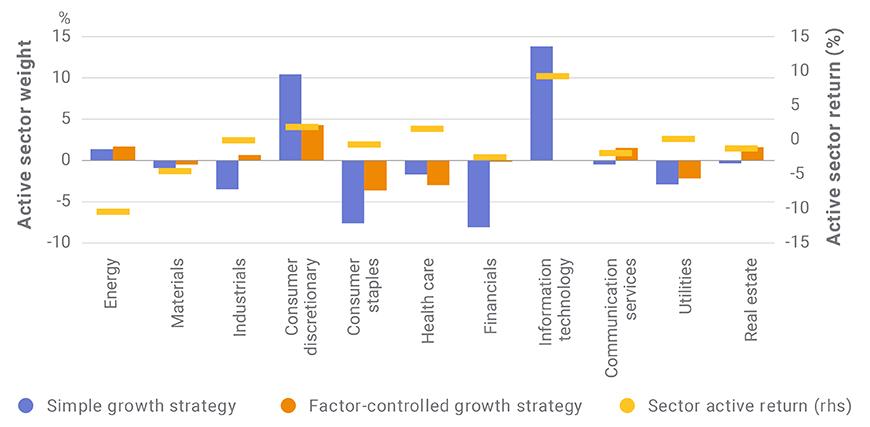
Data from June 2013 through August 2019
While sector exposures contributed positively to the performance of the simple growth strategy in recent history, they were unintended and, as shown in the exhibit below, their positive contribution to return was not persistent over time. For the period from June 2001 through May 2013, the simple growth strategy’s sector exposures were similar to those during the period from June 2013 through August 2019, but the sector returns were quite different. And, as we can see, IT’s large positive contribution in the later period is notably absent in the earlier period.
Factor-controlled growth strategy was less tied to sector performance over the long term
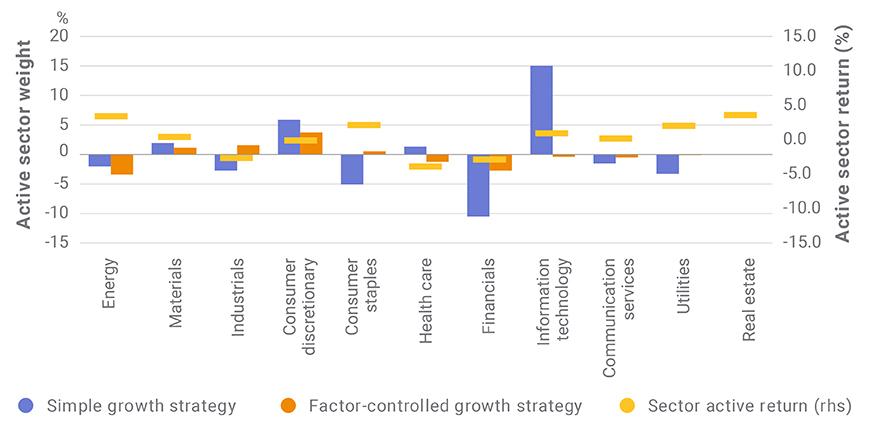
Data from June 2001 through May 2013
As we can see, to answer whether growth’s recent performance is an anomaly really depends on what we mean by growth. If we mean a simple strategy that selects high-growth stocks, then the recent performance is not representative of that strategy’s long-term historical performance. In this case, we can attribute the recent outperformance relative to the long term to non-growth factors and particular sectors — exposure to which has not been as detrimental recently as it has been over the long run. But for a factor- and sector-controlled growth strategy, the performance is mainly driven by exposure to the growth factor. In this case, the recent outperformance has been in line with the longer-term outperformance.
1Growth scores used in the analyses in this blog are based on MSCI’s Barra Global Total Market Equity Model for Long Term Investors (GEMLT) growth factor. The factor is constructed from three growth descriptors: earnings-per-share growth, sales-per-share growth and predicted earnings growth.
2Please see Case 3 methodology in Alighanbari, M., Melas, D., and Sharma, S. 2019. “The growth-factor premium: Seeking a systematic approach for capturing it.” MSCI Research Insight.
3GICS is the global industry classification standard jointly developed by MSCI and Standard & Poor’s.
4In this strategy, in addition to controlling for the exposure to non-target factors, the active weight to sectors and countries is also explicitly constrained on each rebalancing. For more details on the methodology, please see Case 3 methodology in Alighanbari, M., Melas, D., and Sharma, S. 2019. “The growth-factor premium: Seeking a systematic approach for capturing it.” MSCI Research Insight.
Further Reading
The growth-factor premium: Seeking a systematic approach for capturing it
