- European equity markets were among the worst-hit by the Russia-Ukraine war, given Europe’s proximity, but were also the quickest to recover. The war accelerated the divide between countries, sectors and factors.
- Real yields (net of inflation expectations) remained high relative to recent history, but investors tempted to increase bond stakes may wish to assess the risk of further central-bank actions if anti-inflation efforts fall short.
- Russia’s invasion may have marked the end of the low-rate, low-return environment since the 2008 global financial crisis that pushed trillions of dollars into real estate, depressed yields and led to record-high property prices.
- Although the war may temporarily boost demand for hydrocarbons, it could accelerate decarbonization in the long run as countries seek to boost their energy security and limit exposure to volatile fossil-fuel prices.
The Russia-Ukraine war had immediate and dramatic effects on global markets. The spike in energy prices following the start of the war directly impacted consumers and industries with energy-intensive costs — particularly for countries with large energy imports from Russia. The spike also worsened an already bad inflation situation resulting partly from highly stimulative fiscal and monetary policies implemented during the depths of the COVID-19 crisis.
Markets have partially recovered since the invasion of Ukraine on Feb. 24, 2022, but important uncertainties remain. Looking forward, we think inflation, economic growth and the effectiveness of monetary policy will broadly drive markets. But many fundamental drivers will also be at play. By better understanding this past year’s performance, investors may be better positioned to analyze risks and opportunities in 2023.
Equity markets were volatile and provided some surprises
Global equity markets experienced a shaky year since the Russian invasion. The conflict had some stark economic and investment repercussions such as the exodus of some big multinational companies from Russia and the exclusion of Russian companies from the MSCI Emerging Markets Index. Macroeconomic concerns such as energy-price-led inflation and rising rates, coupled with the political uncertainty caused by the war, led to equity-market drawdowns that lasted as late as September 2022 for all major global markets. Over the past 12 months, emerging-market and U.S. equities suffered the most.1
Contrary to what many would have expected, given Europe’s proximity to the war, European equity markets did not do as badly as feared and — in fact, if measured in local currency over the one-year period — ended up 2%. The U.S. dollar’s strengthening against major European currencies did pull down the MSCI Europe Index’s USD returns (for international investors) to 3%, but the dispersion of returns among European countries remained high. Countries with both geographical proximity to the conflict zone and gas dependency on Russia (notably, Hungary, Poland and Germany) exhibited high negative returns. The U.K. had a strong finish to the year despite being hit hard by energy-price inflation.
One-year performance of global and European equity markets


Data from Jan. 31, 2022, to Jan. 31, 2023. Gross returns in USD and local currency. Right plot: Blue — MSCI Europe Index (developed-market) countries. Red — MSCI Emerging Markets Europe Index countries. Turkey is an outlier (with >100% returns) and not shown in the plot. Max drawdown is the maximum loss, based on daily returns, from peak to trough over the period shown. For market-illustrative purposes during this period only and may not represent long-term index performance.
The role of industry and factor rotations in Europe’s recovery
Despite fears of recession and uncertainty on meeting Europe’s energy needs leading to spiking energy prices in several European countries, some factors worked in favor of Europe in the past year and helped it recover more quickly than imagined. While European equity markets plummeted more than others at the onset of the war, these factors propelled a swift turnaround in the fourth quarter of 2022, when Europe outperformed the U.S. and emerging markets.
Not only was Europe able to reduce its dependency on Russian gas by securing alternative supplies of liquefied natural gas (LNG) from the U.S., the warmer-than-usual winter led to less depletion of reserves than expected. Marginal expansion of business activity, slower- and smaller-than-expected central-bank rate hikes and China’s lifting of COVID-19 restrictions could also have played a role.
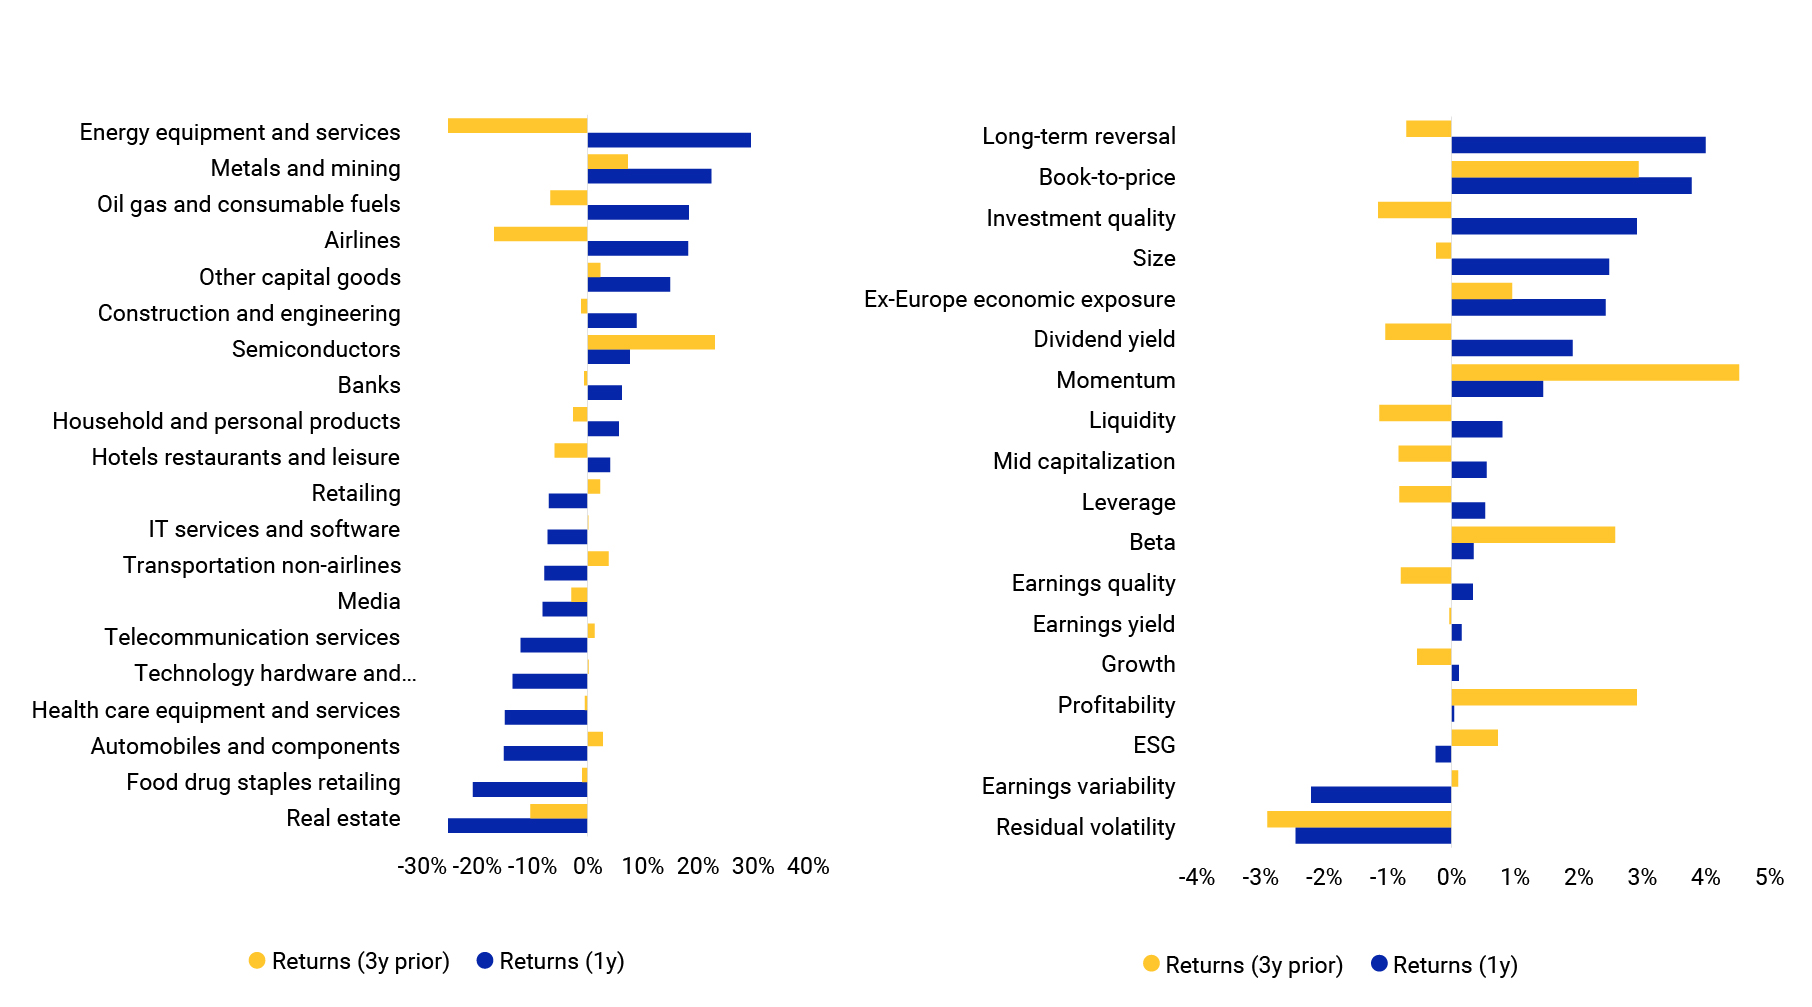
Industries in the energy sector, as well as banks and airlines, benefited from investor rotation and emerged as winners.2 This trend helped European equities in general (compared to those in the U.S.)3 — and U.K. equities in particular — given their high exposure to the financial sector. Real estate, technology hardware and equipment, peripherals and telecommunications services did not fare well. As previously highlighted, U.S. stock-market performance was heavily influenced by the volatile share prices of Big Tech.
On the factor front, the performance of value (as measured by book-to-price ratio and long-term reversal) became more pronounced. High inflation and the corresponding rate hikes across the globe had a negative impact on growth-oriented strategies. European equities benefited from exposure to the value factors, reinforcing the traditional view of U.S. equities as a “growth” play vs. European equities as a “value” play. Equity markets also continued to punish high-risk stocks.
Best-/worst-performing industry and style factors

Data from Jan. 31, 2019, to Jan. 31, 2023. Source: MSCI’s Barra EULT
Bond market refocused on central banks and inflation as war dragged on
The bond market’s initial response to Russia’s invasion was swift. Government yield curves shifted upward, and corporate-bond spreads widened. Spreads widened less in the U.S. and more in Europe, again due to the latter’s greater dependency on Russian energy imports. Hard-currency Russian sovereign bonds were priced to default, and many emerging-market bonds traded off sharply as the U.S. dollar strengthened.
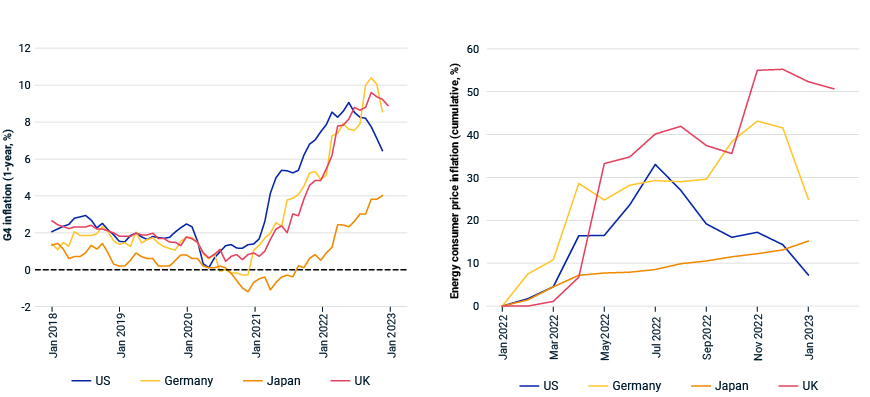
A bad inflation situation turned worse

One year after the invasion, the large cumulative negative returns of both bonds and equities represent a direct challenge to the view that bonds offer strong diversification benefits in 60/40 equity/bond portfolios, as well as in mixed portfolios with equities and other asset classes. This co-movement of returns stands in strong contrast to the relationship that prevailed during the prior 20 years when large stock sell-offs tended to coincide with bond rallies. MSCI modeling suggests that the credibility of central banks may play an important role in the co-movement of the two asset classes.
Central banks had large impact
When faced with deteriorating economies and higher inflation, central banks chose to focus on battling inflation. Now, one year later, inflation has started to decline — with energy prices falling significantly. Bond-market pricing reflects the general belief that major central banks will be able to successfully drive inflation toward 2% policy targets over the next several years. Market belief that central banks may be able to successfully engineer a “soft landing” is growing. In response, the broader bond market has significantly recovered from its lows experienced in the second and third quarters of 2022.
But volatility in the fixed-income market remained high as central banks continued with tight monetary policies designed to lower 40-year highs in inflation. And real yields (net of inflation expectations) are still high, as of this writing, relative to recent history. Bond investors tempted to increase allocations will weigh doing so against the risk of further aggressive central-bank actions if existing anti-inflation efforts fall short.
Investors consider whether lower inflation will result in strong bond performance in 2023

Russia’s invasion seemed to signal a new era for commercial real estate
The low-rate, low-return environment since the 2008 global financial crisis drove a boom that pushed trillions of dollars into global real estate,4 which depressed yields and drove prices up to record levels, according to the RCA CPPI. Russia’s invasion now appears to have signaled the end of that expansion and the start of a transition to a new world of higher rates and higher returns. The rapid rise in swap rates meant debt costs surged above property yields after years when a substantial gap had encouraged capital into the sector.
The impact of rising interest rates was most acutely felt in Europe, and particularly in Germany, where the country’s reliance on Russian energy proved to be its Achilles heel. As such, German property sales started to slow in April, sank to a six-year low for the first half of the year and continued to fade through the rest of 2022. That said, global transaction volumes were down 64% in the fourth quarter, and very few countries escaped the slowdown, as buyer and seller price expectations moved apart, leading to a substantial drop in liquidity.
In the short term, further easing in inflation, plus stability in bond yields and debt costs, would provide a degree of security and give buyers and sellers more solid ground on which to make their buy-sell-hold decisions.
Once past this shorter-term disruption, the question is where real estate fits into a remodeled investment landscape. Core property effectively acted as a bond substitute during the low-rate regime, but interest rates and bond yields will likely settle at a higher level than during the last cycle. This means property may serve a different purpose in a multi-asset-class context.
Rising rates have eroded property’s competitive advantage

Chart shows basis-point spread and office yields to 10-year government bonds. Source: RCA Hedonic Series office yields
While adding to emissions in the short term, the war may speed the energy transition
Russia’s invasion of Ukraine triggered a restart of idled coal- and oil-fired power plants across the world, auctioning of new oil and gas leases in the U.K.5 and U.S.,6 gas-import infrastructure expansion (particularly in Europe7) and further support for coal buildout (especially in China and India8) amid rising concerns about energy security and affordability. These factors and the easing of COVID-19 restrictions in China may drive a further increase in global fossil-fuel emissions until the mid-2020s.9 This may be especially true in emerging markets, where projected company emissions were already misaligned with global temperature targets, based on MSCI’s Implied Temperature Rise (ITR) analysis.10
ITR across select MSCI Indexes

The chart shows the ITR average weighted by market capitalization of the constituents of the mentioned MSCI indexes as of Feb. 8, 2023. IMI stands for Investable Market Index and EM stands for emerging markets. Source: MSCI ESG Research
Subsidies aim to accelerate green investments
Fossil-fuel consumption may peak by the mid-2020s11 as the Russia-Ukraine war slows global economic growth and curbs hydrocarbon production in Russia,12 while clean energy may meet most of the expected growth in demand through 2025, despite temporary headwinds from windfall taxes, trade conflicts and high interest rates.13 Russia’s invasion gave a short-term boost to fossil fuels, yet it also spurred a clean-energy arms race.14
Countries have moved to offer more-generous green subsidies (e.g., the Inflation Reduction Act in the U.S. and the EU’s Green Deal Industrial Plan and REPowerEU); addressed permitting delays and overdue subsidy payments owed to clean-power companies (China); and, in some cases, reversed nuclear-phaseout plans (Japan15 and South Korea16) to boost long-term energy security. These policies may allow companies to significantly boost their share of green revenues by increasing investment in clean technologies.
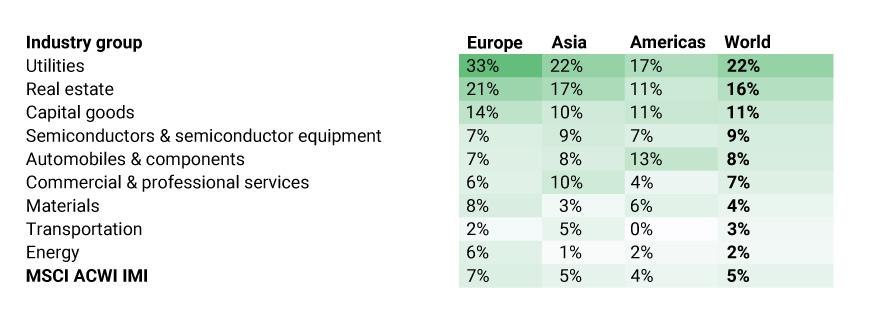
European and Asian companies had higher annual shares of green revenue vs. Americas peers

The data represents a simple average of the most recently disclosed annual green revenues for the constituents of the MSCI ACWI IMI, as of Feb. 9, 2023, for seven Global Industry Classification Standard (GICS®) industry groups with the largest share of green revenues globally, plus transportation and energy. The data represents the combined share of all company revenues derived from any of the six environmental-impact themes, including alternative energy, energy efficiency, green building, pollution prevention, sustainable water and sustainable agriculture. For more information, see: “MSCI Sustainable Impact Metrics Methodology,” August 2021. GICS is the industry-classification standard jointly developed by MSCI and S&P Global Market Intelligence. Source: MSCI ESG Research, company filings
Energy efficiency may limit companies’ price risk amid uncertainty
Although energy prices have declined sharply since their rally in 2022, wholesale natural-gas and power prices in Europe could remain at least three times their 2016-2022 average level until 2027.17 Thus, companies that use energy more efficiently could be better positioned to weather ongoing uncertainty over energy prices and availability.
Some European companies used energy much more efficiently than others

Revenue-based intensity of energy consumption for Europe-based energy, utilities, materials and transportation constituents of the MSCI ACWI Index, as of Feb. 9, 2023. The chart shows companies with the highest (in red) and lowest (in green) energy intensity within their GICS industry group. Source: MSCI ESG Research, company filings
1All one-year performance is for market-illustrative purposes during this period only. It may not represent long-term index performance.
2Industry classifications are taken from MSCI’s Barra Europe Long-Term Equity Model (EULT).
3Industry trends in global and European equity models were qualitatively similar.
4USD 11.6 trillion spent on income-producing property from 2010 to 2022.
5Mathis, Will. “UK Draws More Than 100 Bids for New Oil, Gas Sites in North Sea.” Bloomberg, Jan. 17, 2023.
6Mindock, Clark. “Biden rubberstamped Trump-era oil and gas leases in New Mexico's Permian Basin.” Reuters, Jan. 24, 2023.
7Zaretskaya, Victoria. “Europe’s LNG import capacity set to expand by one-third by end of 2024.” U.S. Energy Information Administration, Nov. 28, 2022.
8Mukherji, Biman, and Su-Lin Tan. “Can coal-reliant China and India make a smooth transition to green energy?” South China Morning Post, Feb. 7, 2023.
9“World Energy Outlook 2022.” International Energy Agency, Oct. 27, 2022.
10ITR is designed to show the temperature alignment of companies, portfolios and funds with global climate targets. It compares a company’s current and projected greenhouse-gas emissions across all emission scopes with its share of the remaining global carbon budget for keeping global warming well below 2 degrees Celsius (°C). It converts a company’s “undershoot” or “overshoot” of its carbon budget to an implied rise in average global temperatures this century, expressed in °C.
11“World Energy Outlook 2022.” International Energy Agency, Oct. 27, 2022.
12“Energy Outlook 2023.” BP, Jan. 30, 2023.
13“Electricity Market Report 2023.” International Energy Agency, Feb. 8, 2023.
14Horowitz, Julia. “A subsidy arms race is kicking off between Europe and America.” CNN, Feb. 10, 2023.
15Yamaguchi, Mari “Japan adopts plan to maximize nuclear energy, in major shift.” Associated Press, Dec. 22, 2022.
16“South Korea increases expected contribution of nuclear power.” World Nuclear News, Jan. 12, 2023.
17Schülde, Markus, Xavier Veillard, and Alexander Weiss. “Four themes shaping the future of the stormy European power market.” McKinsey, Jan. 27, 2023.
Further Reading
Which Factors Rose with the Price of Oil?
Four Scenarios for 2023: Navigating Uncertainty
2023 Trends to Watch in Real Assets
Inflation Reduction Act May Energize Utilities’ Energy Transition
