When markets get volatile, stock prices can move very quickly in a short period. As we saw in the August 2007 “quant liquidity crunch”— now about to mark its 10-year anniversary — many quantitative equity managers could have benefitted from getting market insights in real time as they found themselves in crowded trades.
One challenge for institutional investors is to find real-time data in order to respond to market events as they unfold. This need for transparency may be especially true where fund managers have exposure to factors that may experience high volatility in crisis periods. Real-time index levels can help them monitor fast-changing equity markets through the lens of factor returns.
When we look back to the August 2007 liquidity crunch, what does the real-time tick data tell us?
During the summer of 2007, stock prices were whipsawed as many quant managers struggled to raise cash to meet collateral requirements in their multi-strategy funds. However, while many fundamental long-short funds took it on the chin, broad U.S. equity market performance was basically flat in the early days of the crisis.
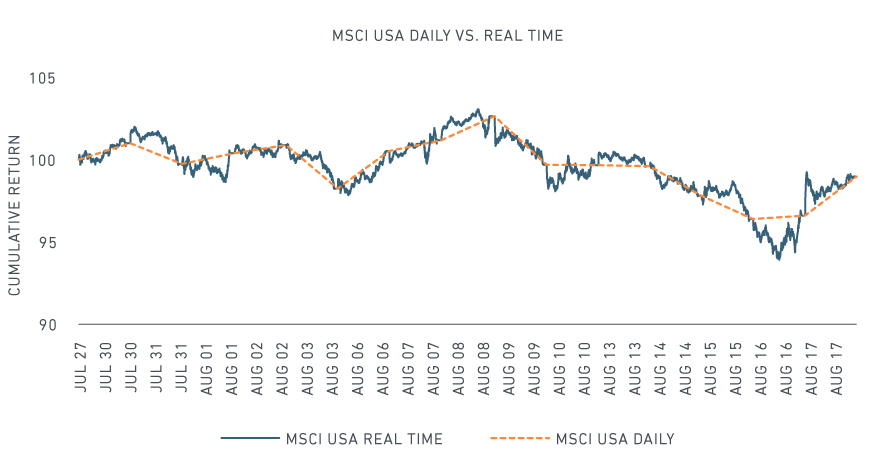
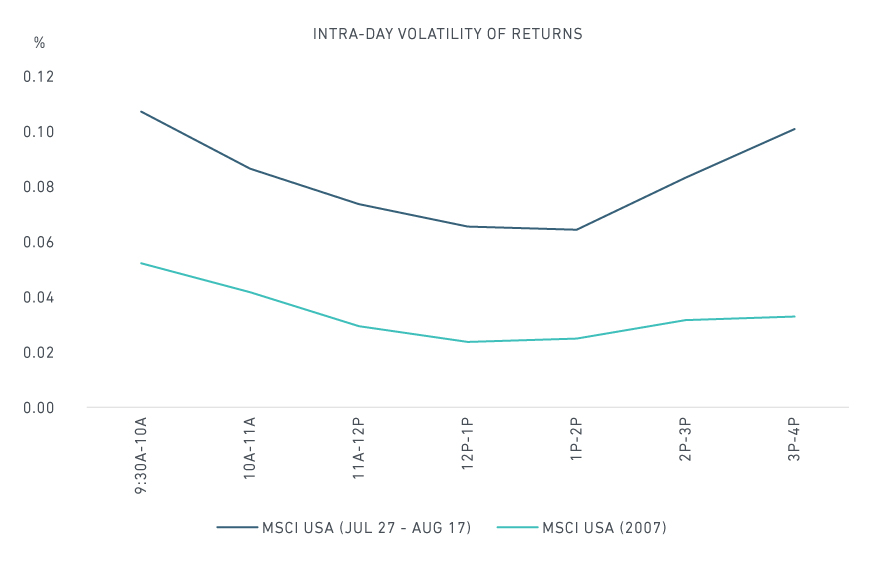
However, that performance masks the volatility that took place during individual days. Looking at index-level performance on an intra-day level, the U.S. stock market ended the two-week period from July 27 to August 17 almost where it began, but it experienced a number of days with considerable intra-day reversals (see top panel of the exhibit below). Furthermore, the bottom panel shows that return volatility jumped during the first and last hour of each day during the crisis period, in contrast to the much lower intra-day volatility over the full year.
Intra-day data tells a different story than end-of-day data


Return volatility measured as the interquartile range of minutely returns within each hour
The crisis peaked during the week of August 6 as stress in mortgage markets triggered liquidity needs in multi-strategy funds. As a result, many managers of these funds unwound their equity positions (because they were the most liquid) in order to meet collateral requirements. Some factors were particularly hard hit: The MSCI US Total Market Model indicates that value, momentum and quality were the style factors with the largest drawdowns during August 2007.
If quant managers had access to real-time returns of fundamental equity factors, they may have detected underlying stress in their strategies sooner.1 Real-time factor returns, however, have not been readily available to investors.
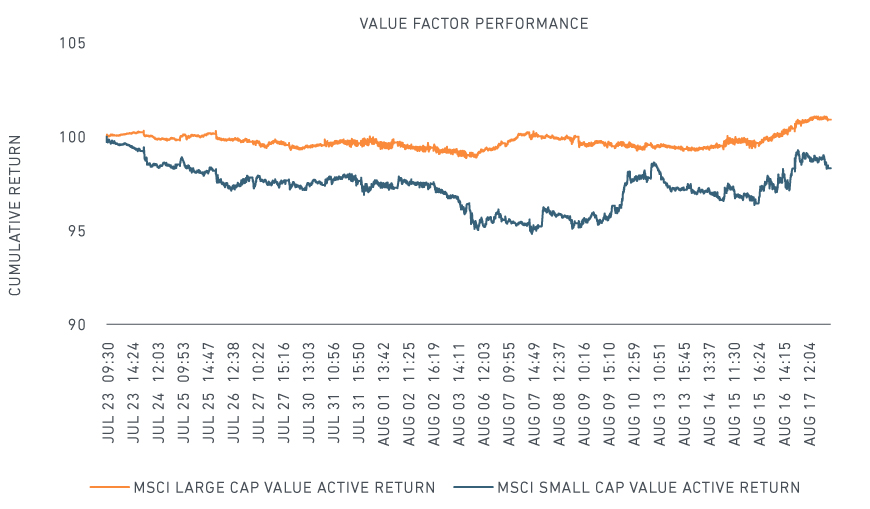
To gain more insight using factors, we use intra-day tick data on the MSCI Large Cap Value and MSCI Small Cap Value indexes to approximate factor returns. This approach allows us to trace how one common equity style — value — reacted in the weeks prior to the unfolding crisis. We make three observations from the two exhibits below that might have informed investor decisions had they had this information available at the time of the liquidity crunch.
The top panel shows that investors holding small-cap value stocks suffered heavier losses than those holding large-cap value stocks during the three-week period from July 23 to August 17. Notably, small-cap value investors incurred several sharp drawdowns during the week of August 6, before recovering some of their losses with a morning rally on August 10.
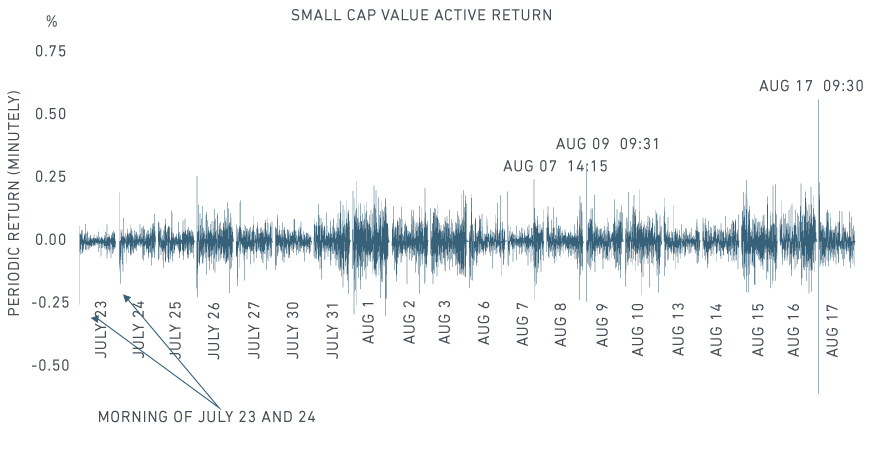
The selloff in small-cap value stocks began in late July – two weeks before the peak of the crisis. Large drops occurred during the mornings of July 23 and 24 (bottom panel).
The volatility of the factor surged on July 26, abated for two days, and then rose again the afternoon of July 31 and the morning of August 1. This was several days before the large price swings that would occur on August 7, 9 and the 17 (bottom panel).
How Value reacted to the Quant Liquidity Crunch


During the August 2007 quant liquidity crunch, institutional investors underestimated the speed and magnitude of losses – and subsequent reversals — that took place over very short periods. They also failed to appreciate how crowded certain investment styles had become. Using high-frequency indexes (both market capitalization-weighted and factor-based approaches) can help investors monitor events in real time.
The author thanks Peter Zangari for his contribution to this post.
1 http://web.mit.edu/Alo/www/Papers/august07.pdf
Further reading:
MSCI Real Time Indexes History
Measuring the impact of factors
