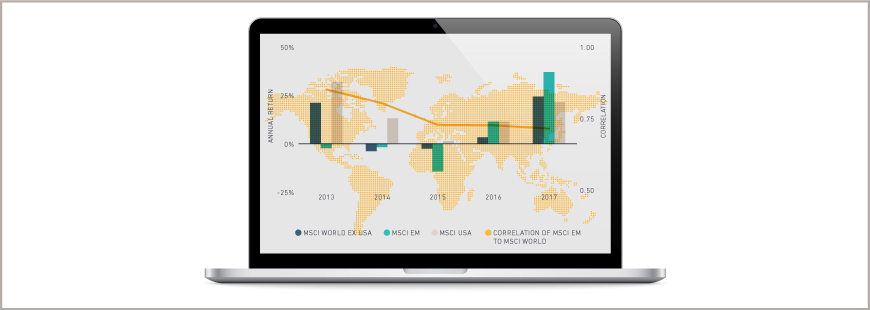
The emerging markets rally, the U.S. dollar’s depreciation and the resurgence of global growth were the top three drivers behind a double-digit rally in global equities last year. Stocks were led by the MSCI Emerging Markets Index’s 38% return. Developed markets, as represented by the MSCI World Index,1 returned 23% last year. As we enter 2018, investors will monitor whether these themes continue into the New Year.
Emerging markets: Emerging markets benefited from a trio of equity gains, currency appreciation and tightening spreads on sovereign bonds. The now two-year-old emerging market equity rally partly reversed the 2013 to 2015 decline.
In addition, developed and emerging markets continued to decouple, after correlations peaked during the mid-2000’s. One reason for this drop in correlations is that many emerging market economies are becoming more distinct from one another – a point we will return to later.
Emerging markets continue their rebound
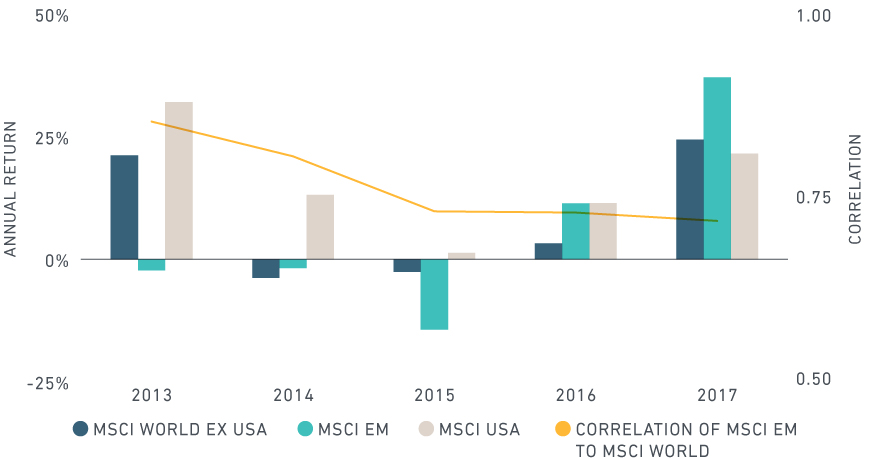
Returns are gross in USD; correlation based on rolling 36 monthly returns.
The U.S. dollar: The dollar declined against the major currencies throughout the year. It fell against developed and emerging market currencies alike, tallying double-digit losses against the euro, British pound and Korean won. As the next exhibit shows, this resulted in a generous tailwind to robust local market returns for dollar-based investors. International developed stocks benefited the most: Currency accounted for almost 40% of the total return in the MSCI World ex USA index.
Currency gave a big boost to dollar-based investors
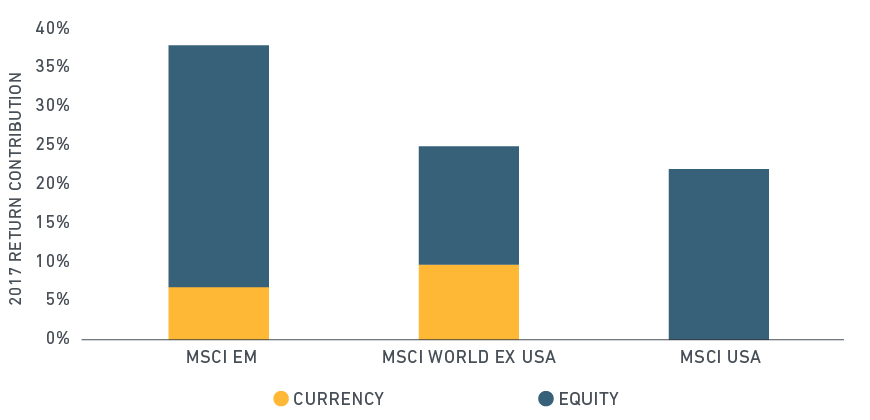
Returns are gross. Currency return calculated as difference between index return in local currencies and index return in USD.
Currencies, particularly in the emerging markets, are commonly closely linked to investor appetite for a country’s financial assets and to the underlying economy. In 2017, investors benefited from a “Goldilocks” environment of low inflation and corporate earnings growth.
Global earnings growth: Year-over-year earnings growth was positive for most of the countries in the MSCI ACWI Index, particularly in the second half of the year when earnings in European countries ticked upwards. Previous MSCI research demonstrated that dividends and real earnings growth are often the principal drivers of long-run equity returns.2 However, valuation changes can have a substantial impact over shorter horizons. The exhibit below decomposes the return for selected regions into dividends, real earnings growth, inflation and changes in valuation.
Real earnings growth drove returns in 2017
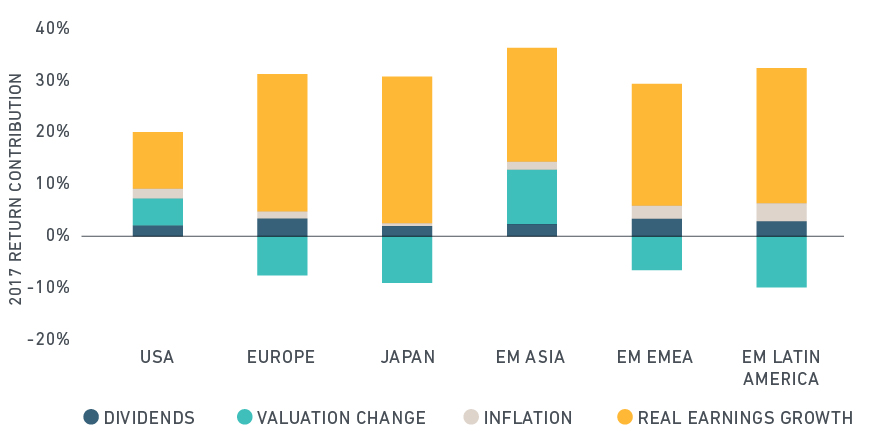
Return decomposition based on method described in Ibbotson-Chen (2003) and Ferreira-Santa Clara (2011). Log of return of the index is the sum of the log of returns from dividends, changes in valuation, real earnings growth in USD and inflation. Inflation sourced from Organisation for Economic Cooperation and Development (OECD) for each region and country based on third quarter 2017 data. All other fundamental data sourced from MSCI.
Firms in the major economic regions grew their earnings, shown in the yellow bars. Asian emerging markets, particularly China, Korea and India, benefited not just from growth but also from valuation expansion (light blue bars). Risk appetite for assets in these countries increased.
Valuations were diverse across regions and individual countries. International developed markets, particularly Europe and Japan, benefited from growth, but suffered from valuation contraction. While not shown, valuations expanded in Germany while they contracted in the United Kingdom. The difference could indicate that investors favored the relative stability of the former over the latter, where Brexit uncertainty loomed large.
Finally, we can use these themes to help explain the different fortunes between individual countries. The last exhibit plots the returns of the major countries in the MSCI ACWI Index against their year-over-year growth in real earnings. Colors indicate market classification: blue for developed and yellow for emerging markets.
Developed market vs. emerging market country returns (2017)
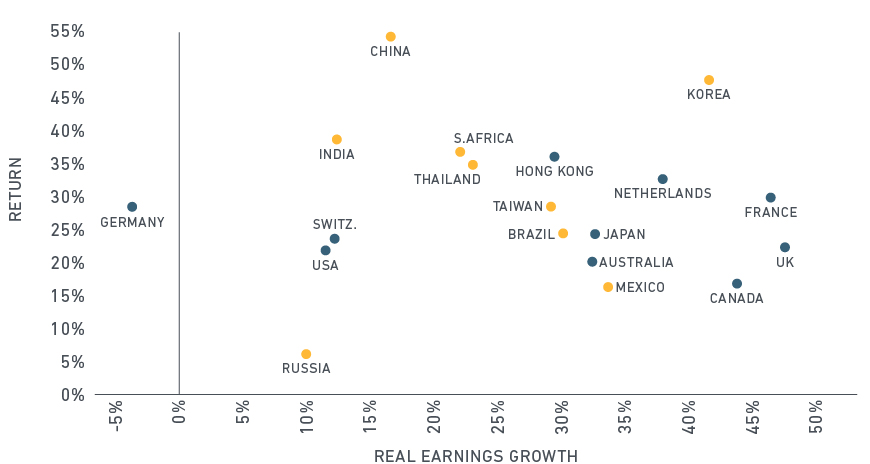
Returns are gross in USD. Top 10 countries by market capitalization for emerging and developed markets are shown.
As we can see, the largest countries had a positive return last year. There was a wide dispersion however, particularly in the emerging markets. MSCI risk models show that in today’s regime of low market volatility, sectors are commonly the main driver of return differences between stocks — more so than style factors and country membership.3 This implies that the wide variation in returns and growth rates between countries could largely be due to their sector makeup.
Technology and materials – two sectors flush with firms that grew earnings – were two of the top-performing sectors last year. Additionally, looking through the lens of factors, the momentum factor topped all other factors, outperforming the value factor by 10%. Throughout the year the MSCI ACWI Momentum Index overweighted growth stocks in semiconductors, technology services, electronics and industrial metals.
Emerging market returns reflected these sector trends. China and Korea, for example, far outpaced other countries due in part to their technology services and semiconductors industries. In that respect, 2017 was part of a longer-term trend in emerging markets: They have become more heterogeneous because of their varying political risk and sector makeup.
Low inflation, low market volatility and real earnings growth were positive drivers in many equity markets last year. Sources of return — and future risks — can be very different even in a market that lifts all countries. Whether these favorable conditions can persist, and how well individual countries are positioned to benefit if they do, will no doubt be on investors’ minds in 2018.
1 The MSCI World Index comprises large- and mid-cap stocks across 23 developed markets
2 https://www.msci.com/www/blog-posts/what-matters-for-investors-in/0364508701
3 December 2017 Risk Monitor: Barra Global Total Market Equity Model for Long-Term Investors
Further reading:
Are market valuations in nosebleed territory?
