- MSCI ACWI climate indexes showed mixed performance compared to the MSCI ACWI Index in the third quarter, but demonstrated resilience compared to the second quarter.
- The relative outperformance of energy stocks contributed significantly to the underperformance, but the return contribution from carbon-efficient companies within each sector was positive.
- Within the energy sector, companies with strong management of low-carbon transition risks outperformed their peers, highlighting the importance of managing these risks.
High oil prices continued to be the dominant global headline in the third quarter. But MSCI Climate Indexes1 — with historically lower allocations to energy companies — showed greater resilience in the third quarter than the second. For investors, a key question may be how close they seek to hew to the MSCI ACWI parent index in their climate allocations.
The energy sector — proxied by the MSCI ACWI Energy Index — outperformed the MSCI ACWI by 5.43% in the third quarter. But how individual MSCI Climate Indexes performed in the quarter reflected their respective approaches.
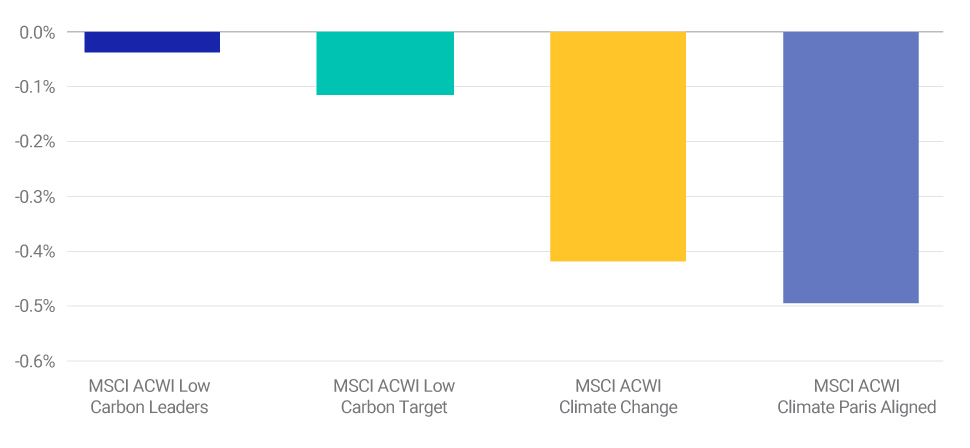
For example, the MSCI ACWI Climate Change and MSCI ACWI Climate Paris Aligned indexes, significantly underweighted energy stocks (see exhibit below), adversely impacting performance of these indexes relative to the MSCI ACWI. Historically, they have exhibited higher tracking error during periods of high volatility (like the Russia-Ukraine war).
In contrast, the MSCI ACWI Low Carbon Leaders and MSCI ACWI Low Carbon Target Indexes, jointly referred as “Low Carbon indexes,” have tighter controls on sector exposures and were underweight energy to a lesser extent than the other climate indexes. As a result, they historically have performed closer to the parent MSCI ACWI Index. In the third quarter, the MSCI ACWI Low Carbon Leaders Index performed better than the MSCI ACWI by 0.06%, while the MSCI ACWI Low Carbon Target Index underperformed by 0.18%.
Active energy allocations for the MSCI ACWI Climate Indexes

Differences between the energy sector allocation in the MSCI ACWI climate indexes and the MSCI ACWI. Active allocations represent over- or under-weights to the energy sector, as of June 30, 2022.
Short-term vs. long-term performance
TThe exhibit below shows the short- and long-term performance of the MSCI ACWI Climate Indexes. While the MSCI ACWI Climate Change and Climate Paris Aligned Indexes have historically outperformed the MSCI ACWI over longer time periods, they underperformed the MSCI ACWI in the second quarter. This short-term underperformance continued in the third quarter, although the level of underperformance was lower.
Historical active returns for the MSCI ACWI Climate Indexes
| ACWI Low Carbon Leaders | ACWI Low Carbon Target | ACWI Climate Change | ACWI Climate Paris Aligned | |
| Q3 2022 | 0.06% | -0.18% | -0.18% | -0.35% |
| Q2 2022 | 0.21% | -0.33% | -1.15% | -0.59% |
| YTD | 0.12% | -0.58% | -2.19% | -1.83% |
| 1 Year | 0.12% | -0.58% | -1.43% | -1.72% |
| 3 Years | 0.15% | -0.10% | 0.78% | 0.12% |
| 5 Years | 0.14% | -0.03% | 0.65% | 0.40% |
| Long term | 0.08% | -0.01% | 0.74% | 0.80% |
Active returns represent the difference between each climate index and the parent MSCI ACWI. Gross returns for the period ending Sept. 30, 2022. Long-term returns are measured between Nov. 29, 2013, and Sept. 30, 2022. Returns are annualized for periods longer than a year.
Drilling down to sector and industry levels
Industry allocations, especially the underweights to oil-related industries (includes integrated oil and gas, oil and gas and consumable fuels and oil and gas exploration and production), played a significant role again in the third quarter, especially in the performance of the MSCI ACWI Climate Change and Climate Paris Aligned Indexes. These underweights detracted from the MSCI ACWI Climate Change Index by 19 basis points (bps) and by 21 bps for the MSCI ACWI Climate Paris Aligned Index in this period (see exhibit below). As expected, oil-related industry allocations had a much smaller impact on the low-carbon indexes.
The MSCI ACWI Climate Change Index has a relatively higher U.S. allocation, and the recent period of dollar strengthening generated a positive currency contribution. However, this was neutralized by a higher China allocation.
The MSCI ACWI Climate Indexes aim to achieve a lower carbon footprint than the broader MSCI ACWI Index. Selections of carbon-efficient companies within each sector contributed positively for all four indexes, which is similar to what we observed for the first half of the year.
Climate indexes performance attribution
| ACWI Low Carbon Leaders | ACWI Low Carbon Target | ACWI Climate Change | ACWI Climate Paris Aligned | |
| Total active | 0.06% | -0.18% | -0.18% | -0.35% |
| Risk indexes | 0.01% | 0.01% | 0.07% | -0.01% |
| (Carbon efficiency) | 0.01% | 0.03% | 0.04% | 0.07% |
| Country | 0.00% | -0.02% | -0.26% | -0.11% |
| Industry | 0.04% | -0.08% | -0.36% | -0.19% |
| (Oil-related industries)* | -0.02% | -0.04% | -0.19% | -0.21% |
| Specific | 0.03% | -0.08% | 0.18% | -0.20% |
| Currency | -0.02% | -0.02% | 0.19% | -0.06% |
The table shows the performance contribution from common factors based on performance attribution using MSCI Global Equity Model (GEMLT). Monthly data from June 30, 2022, to Sept. 30, 2022.
*Includes contributions from integrated oil and gas, oil and gas and consumable fuels and oil and gas exploration and production industry factors.
Low-carbon transition-risk management of energy companies
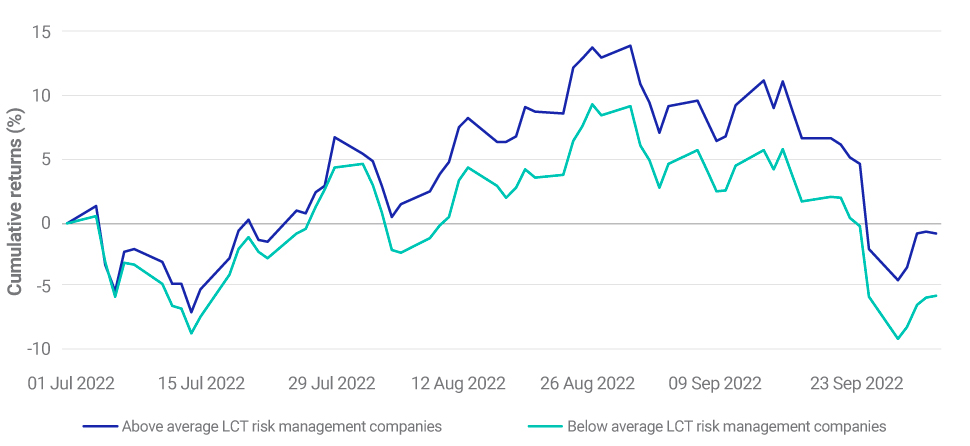
While the energy sector outperformed the MSCI ACWI this quarter, not all energy companies may be equally as efficient in transitioning to a low-carbon environment. We examined the performance of “Above average low carbon transition (LCT) risk management companies” in the MSCI ACWI Energy Index with higher (first and second quartile) LCT risk management2 scores to “Below average LCT risk management companies” with lower scores (third and fourth quartile companies). The above-average LCT risk management companies returned -0.76% for the quarter, while the below-average LCT risk management companies returned -5.69% (as shown below).
Performance of energy sector companies

Cumulative returns for above average and below average LCT risk management companies. June 30, 2022, to Sept. 30, 2022.
It’s a wrap: Mixed results
The MSCI ACWI Climate Indexes had varied performance in the third quarter. While the MSCI ACWI Low Carbon Leaders Index outperformed the MSCI ACWI Index, all other ACWI Climate indexes underperformed, although the scale of underperformance was lower than the previous quarter. Tighter controls on sector allocations for the low-carbon indexes helped them weather energy’s outperformance. Allocations to carbon-efficient companies within each sector also contributed positively to the performance of the climate indexes. While the outperformance of energy stocks detracted from the performance of the ACWI Climate Indexes, energy companies with a superior climate risk management outperformed their sector peers.
1In this blog post, the MSCI ACWI Low Carbon Target, MSCI ACWI Low Carbon Leaders, MSCI ACWI Climate Change and MSCI ACWI Climate Paris Aligned Indexes are jointly referred as the MSCI ACWI Climate Indexes.
2Assessment is based on carbon emissions, product carbon footprint, financing environmental impact, opportunities in renewable energy and opportunities in clean tech.
Further Reading
Climate Indexes Brought Short-Term Gloom with Blooming Offshoots
