- With globalization and continued integration of markets around the world, companies are increasingly exposed to economic activity beyond their domestic borders.
- Understanding geographic distribution of revenues and differentiating between domestic and international companies may enhance the investment-decision processes for constructing and managing global portfolios.
- Historically, domestic companies might not have done as well as their more internationally orientated counterparts.
When a reporter asked famed bank robber Willie Sutton why he robbed banks, he reportedly said, “Because that’s where the money is.” It’s a great story and easy to assume it’s true; unfortunately, it’s not. In much the same way, investors may look at the fact that the weight of North American companies in the MSCI ACWI Index is at an all-time high — representing approximately 60% of the total market-cap weight1 — and assume that’s where the majority of the global economic and investment opportunities are.
Where Is the Money?
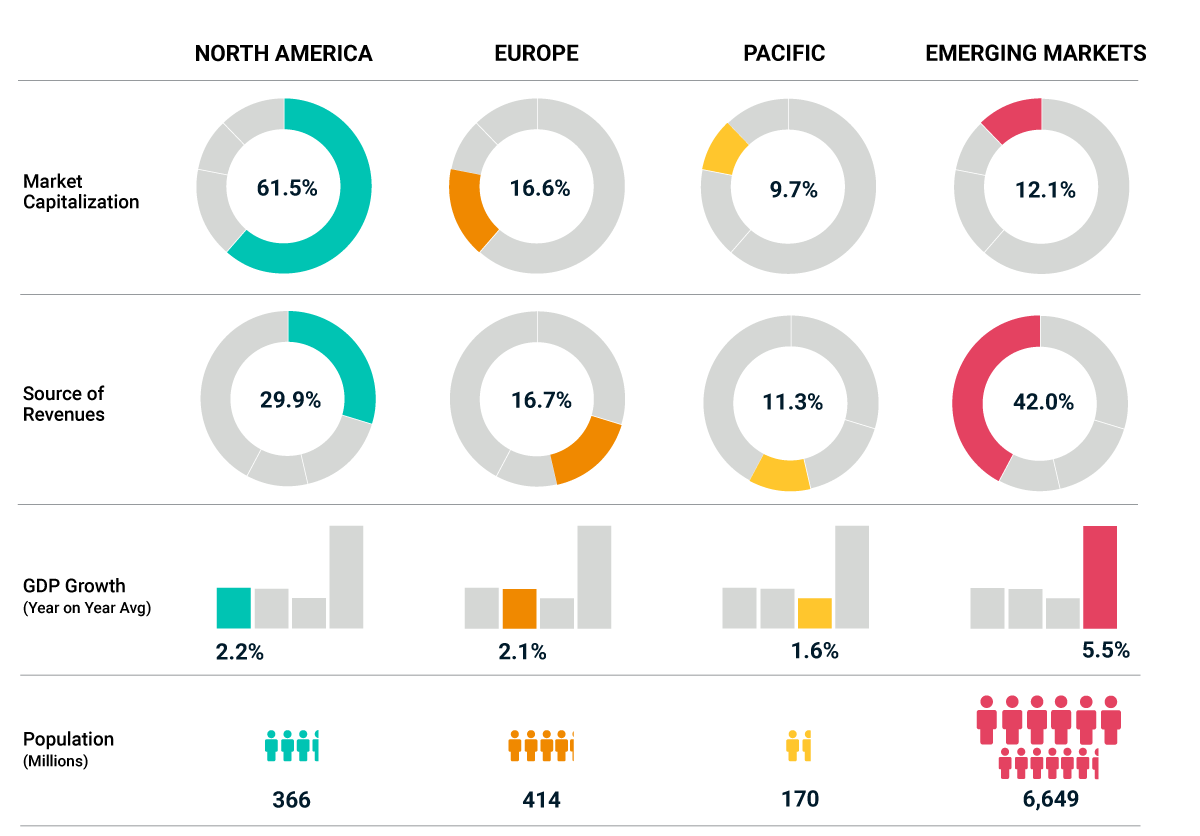
Despite North America’s outsized weighting in the MSCI ACWI Index, as a whole, companies within the index generated only 30% of their global revenues from North America. This may suggest that global investing (in particular, looking beyond North America), can help investors tap into opportunities of economic growth elsewhere.
Take emerging markets (EM) for example. The companies in the region represented only 12% of the MSCI ACWI Index in terms of market cap, but the economies accounted for 42% of the revenues of global companies, as seen in the exhibit below. Over the past 20 years, emerging economies have grown annually roughly 3% faster than developed ones and growth differentials of 2% to 3% per annum are forecast over the next five years, according to the IMF.
Looking Beyond North America

As evident, while a company may be domiciled in one country, it does not imply that the company is impacted by developments in that country alone. To understand how globally integrated a company is — i.e., where a company generates its revenue — we turned to MSCI’s Economic Exposure dataset. Based on the MSCI ACWI Index, we saw a steady increase in emerging economies’ share of global sales revenues in recent years, reaching the 42% highlighted earlier. This illustrates that emerging economies have not only accelerated in terms of economic growth, but also as consumers of global goods and services.
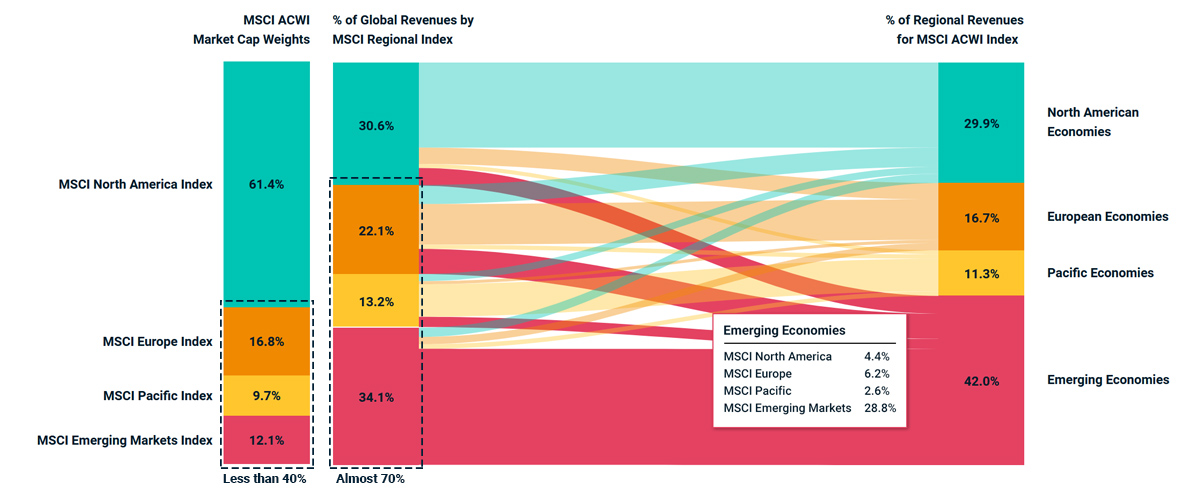
Looking further into the question of revenue, we looked at the dynamics between regional stock markets and regional economies. The exhibit below shows the distribution of sales revenues within various regional and global MSCI indexes and the respective free-float weights. As we can see, although companies outside North America accounted for less than 40% of global equity-market capitalization, they captured almost 70% of the global revenues within the MSCI ACWI Index.
Click here, or on the chart below, for an interactive experience.
Tapping into Global and Regional Revenues

The second column, “% of Global Revenues by MSCI Regional Index,” gives the overall revenues of all the companies in a regional index as a percentage of the overall revenues of all the companies in the MSCI ACWI Index. For example, the MSCI Emerging Markets Index generated 34.1% of all the revenues of the MSCI ACWI Index. The third column, “% of Regional Revenues for MSCI ACWI Index,” is based on the MSCI Economic Exposure dataset applied to the MSCI ACWI Index. It gives the regional origins of all the revenues in the MSCI ACWI Index. For example, in aggregate, all the companies in the MSCI ACWI Index generated 42% of their revenues in emerging economies. The flows between columns two and three illustrate from which regional economies the revenues of the regional indexes come. For example, for the MSCI Emerging Markets Index, 2.3% of revenues (turquoise flow) come from North America, 1.8% (orange) from Europe, 1.1% (yellow) from the Pacific economies (Japan, Hong Kong, Singapore, Australia and New Zealand) and 28.8% from emerging economies (red).
Further, different regional equity markets showed very different levels of sales-revenue diversification. For the MSCI Emerging Markets Index, whose companies generated 34.1% of the revenues of MSCI ACWI, more than 85% of those sales were made within the emerging economies.2 Admittedly, EM is a very wide and varied “region” as it combines emerging Asia, Europe and Latin America. This makes the index reasonably diversified and a useful vector to create investments that can tap into the revenues generated in emerging economies and, by extension, their potential economic-growth opportunities.
The flipside is North America, where almost 70% of sales were generated domestically, as the North American corporate sector has been much more focused on servicing domestic demand than other regions, such as Europe. As a result, the MSCI North America Index was not very diversified in terms of revenues, while the most diversified sales profile was found in Europe, where only about 45% of sales were generated on the continent.
Breaking it Down Sector by Sector
Analyzing revenue exposure from a sector perspective provided additional insights. We looked at what percentage of global revenues was domestically oriented for each MSCI regional sector index (see the exhibit below). It confirmed that the European stock market, as represented by the MSCI Europe Index, leans more toward international sources of revenues. This analysis also showed that many sectors generated the majority of revenues outside the region, in particular health care (80%) and information technology (70%). North American sectors, on the other hand, displayed a significant domestic bias. Every sector except technology generated more than 50% of their revenues domestically.
In other words, looking at a regional or country level may not be enough. Understanding the makeup of sectors can add further important information, as investors orient their decisions on domestic versus international allocations.
Percentage of Domestic Revenues per Regional Sectors
But What About Performance?
Last, but certainly not least, we ask: How did looking at companies through a revenue lens tie into their performance? To analyze this, we looked at the performance of subsets of the MSCI USA and MSCI Europe Indexes since 2002, as proxies for two hypothetical portfolios, consisting of the companies with the greatest domestic revenue.3 Both portfolios markedly underperformed their respective market-cap parent indexes (see the exhibit below), by -1.7% and –2.8% per annum, respectively, illustrating that domestic-oriented companies may have underperformed those with more geographically diverse sources of revenue.
Relative Performance of Europe and US Domestic Stocks
Following the Money
In conclusion, although market-cap weight provided the outline of the story, it leaves out some of the important details. Looking at sources of revenue regionally and by sector can help investors understand the true domestic or global nature of companies as they seek to understand and assess the domestic and international forces that can impact their portfolios.
1As of end of November 2020.
2The MSCI Emerging Markets Index generated 34.1% of the overall revenues of MSCI ACWI; and out of those 34.1%, 28.8% (i.e., 85%) originated from emerging-market economies.
3The design of the MSCI Economic Exposure Indexes aims to strike a balance between high exposure to the target region and adequate market-cap coverage, roughly a third of the market cap of the parent index.
Further Reading
How Diversified Are US Equity Investors?
The Rise of Emerging Markets and Asia
MSCI Perspectives Podcast: No Place Like Home? Revisiting US Portfolios
