- Multi-country, multi-currency futures are linked to indexes that span multiple markets and time zones. We looked at patterns of intra-day futures trading volume to identify liquidity hotspots.
- The volume of futures linked to the MSCI Emerging Markets and MSCI EAFE Indexes were higher during U.S. trading hours, while MSCI World Index futures registered higher volumes during European trading hours.
- Investors looking to leverage pockets of liquidity could target these specific trading sessions when seeking to execute larger orders.
Investors benchmarked to global and regional indexes may use index futures for tactical-positioning hedging purposes, or to implement asset-allocation decisions. However, there are specific considerations that may impact the execution of those decisions. The ability to source on-screen pools of liquidity in the futures market, including the size of the trade and whether a block trade might be preferred, through a basis trade that enables the participant to execute at a price relative to the official close for the underlying index. The liquidity of futures may be active in specific time-zones or specific exchanges, irrespective of whether the underlying market is open or closed.
In this blog post, we highlight the intra-day volume patterns of futures linked to the MSCI World, MSCI Emerging Markets (EM) and MSCI EAFE Indexes to illuminate when market participants report or execute their trades.
Sourcing liquidity in regional futures: On-screen vs. block trades
Investors can trade futures on screen (order book) or using off-exchange negotiations using block-trading facilities. On-screen trading adds to the liquidity of the futures, while off-exchange trades aim to minimize the price impact of large order volumes. The latter doesn’t show up as on-screen liquidity and may be entered in the system at the time of execution, or it can be entered in the system the next day if volumes are above the non-disclosure level. We grouped the intraday data from ICE and Eurex, two futures exchanges, into five-minute intervals and analyzed the trends and patterns of the daily-average volumes.1
Regional futures showed varying volume patterns
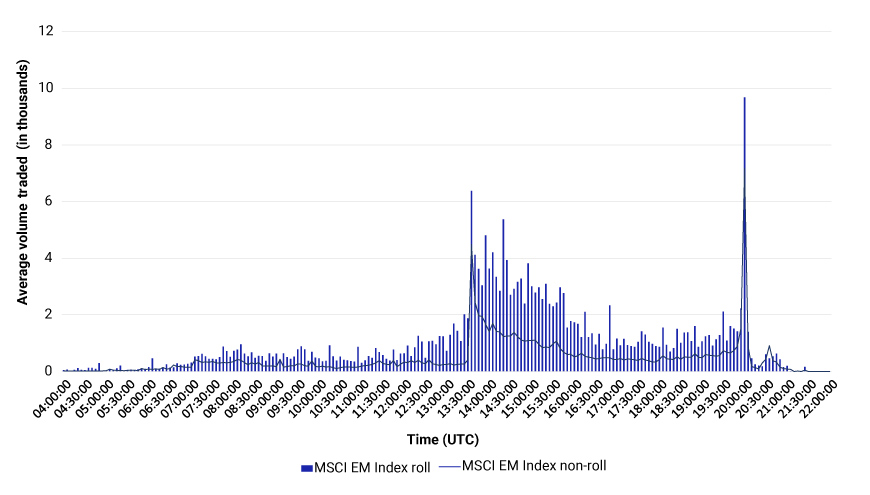
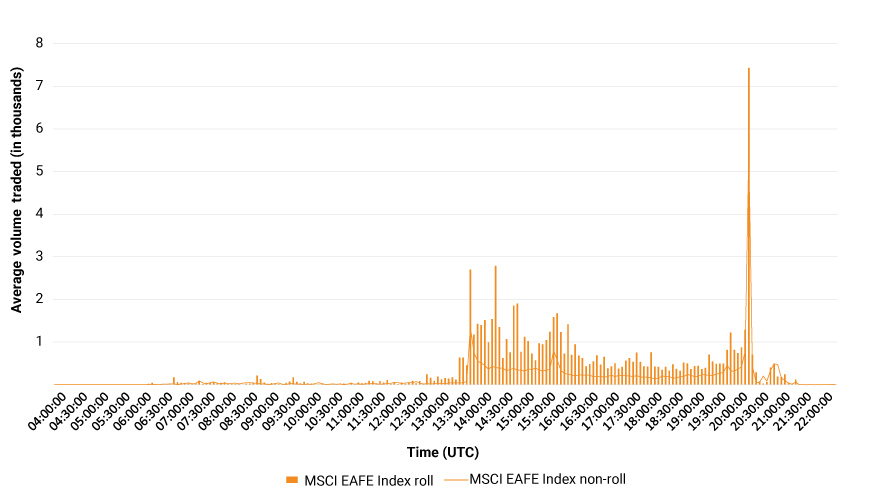
Futures linked to the MSCI EM Index register a modest increase in volumes leading up to, as well as during, European market hours. They had major volume peaks at the U.S. open (1:30 PM to 1: 35 PM UTC), as well as at the U.S. close (7:55 PM to 8:00 PM UTC).2 In contrast, although the MSCI EAFE Index futures registered (on average) a pickup in volume at the U.S. open, a majority of the volume occurred at the U.S. close (as shown below).
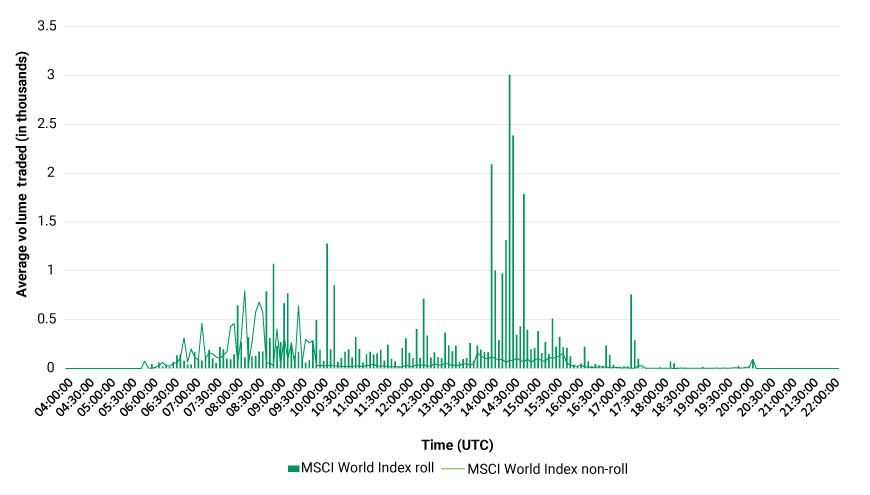
Unlike the MSCI EAFE and MSCI EM Indexes contracts, futures linked to the MSCI World Index registered active trading volumes leading up to, as well as during, the European markets’ opening hour, with peak volumes observed in the U.S. markets’ opening hour. This could reflect block trades that were executed at different times of the day, as well those executed the previous day but recorded the next day due to volumes above the non-disclosure levels. Participants using basis trades may have reported their transactions to the exchange the next day, following the benchmark index’s closing levels.3
The varying activity of futures contracts

Based on data from Eurex, ICE Futures. The information is generated from third-party sources and MSCI does not assert the accuracy of the information. Data from April 1, 2022, to Oct. 30, 2022.
Roll months vs. non-roll months
Investors can roll-over their futures contract from the front-month contract, which may be close to expiration, to another contract in a more distant month. During months of futures expiration — March, June, September and December — volumes are higher compared to other months, and this is reflected in the charts below.
During roll-months, intra-day volumes for the MSCI EM and MSCI EAFE Indexes futures have tended to remain more elevated than during non-roll-months. This indicates participants are spreading liquidity in roll-months throughout the day, although the concentration of activity remained very much at the U.S. close. In contrast, the MSCI World Index futures saw higher volume at the U.S. open during roll-months and early-morning European sessions during non-roll-months, which could be reflective of block-trade and basis-trade activity.
Intraday pattern in volumes: Roll months vs. non-roll months


Based on data from Eurex, ICE Futures. Roll refers to average daily volume in the roll-months whereas non-roll refers to the average daily volumes in non-roll months. X-axis represents Coordinated Universal Time (UTC). Data from April 1, 2022, to Oct. 30, 2022.
Being aware of liquidity hotspots throughout the day
Although MSCI EAFE and MSCI EM Indexes futures had maximum volumes at the close of U.S. markets, they registered steady volumes during the U.S. markets’ opening hour as well. On the other hand, the MSCI World Index futures traded primarily through block trades and were recorded in the system prior to, and during, the European and U.S. markets’ opening hours. Investors looking to leverage pockets of liquidity could target these specific trading sessions when seeking to execute larger orders.
1From April 1, 2022, to Oct. 30, 2022.
2Coordinated Universal Time (UTC).
3For trades at the index close, equity index futures are priced with reference to its prospective closing index levels of the underlying plus an agreed basis price.
Further Reading
Index Replication with Futures in a Deglobalized World
The Futures of Emerging Markets Decoupled
